-
Analysis & Forecast
- Weather
- Ocean
- Ice & Icebergs
- Other Hazards
-
Data
- Digital Forecasts
- Electronic Marine Charting (ECDIS)
- Environmental
- Freezing Spray
- GIS
- Observations
- Ocean
- Past Weather
- Probabilistic Guidance
-
Information
- Product Information
- Receiving Products
-
About
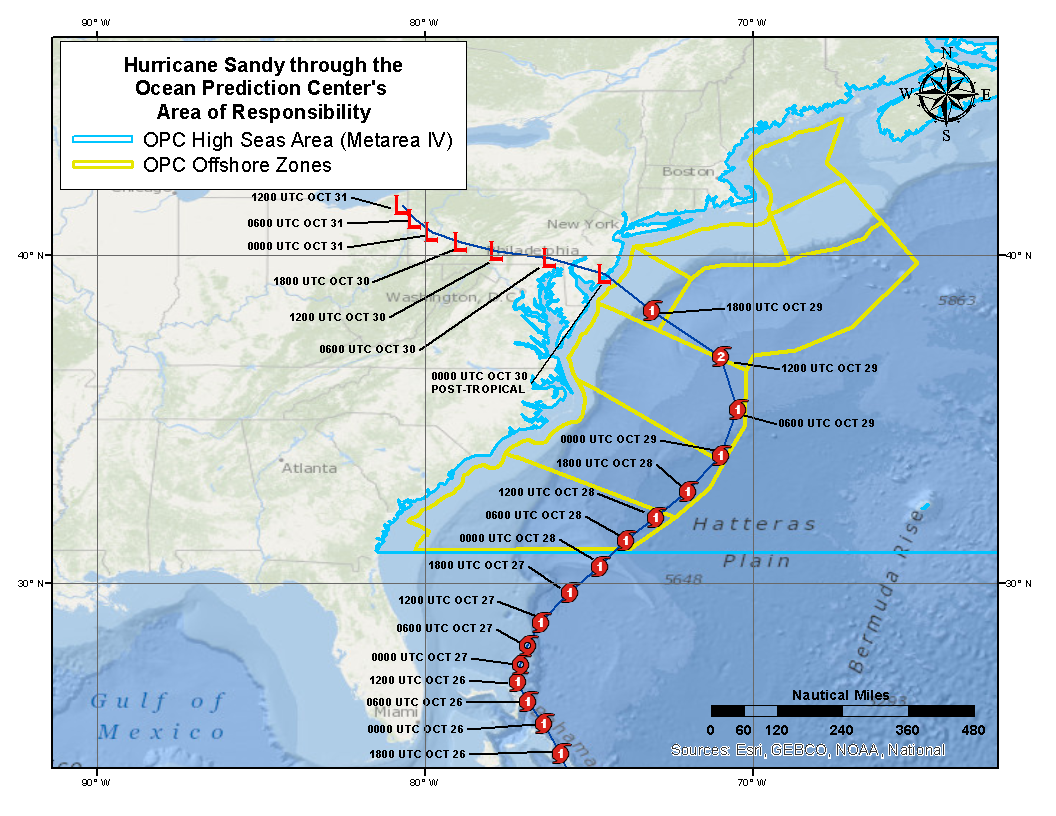
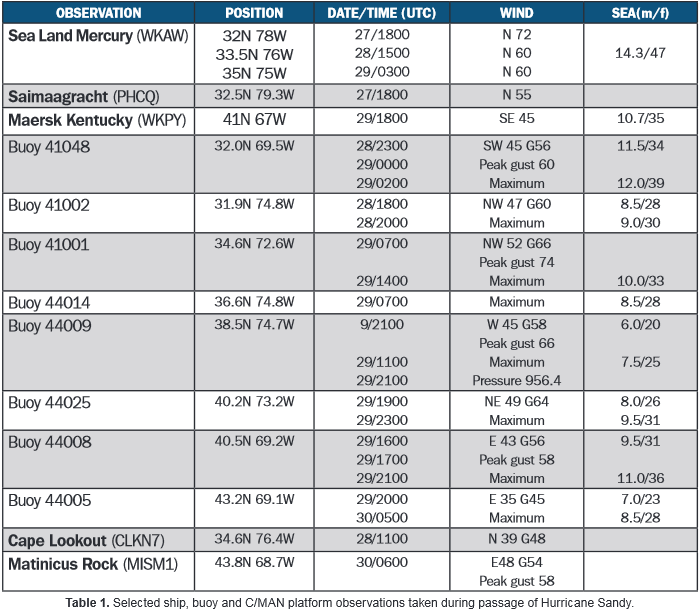
The Ocean Prediction Center and "Hurricane Sandy"
Hurricane Sandy crossed the Ocean Prediction Centers's Area of Responsibility on
October 28, 2012 and October 29, 2012. On those dates, Sandy moved directly
through the Mid-Atlantic Offshore Waters, and the North Atlantic High Seas Forecast Area.
The OPC issued the normal suite of analysis and forecast products throughout the event without interruption.
This allowed mariners in the vicinity of Sandy to remain informed about the potential for hazards associated with high winds and heavy seas.
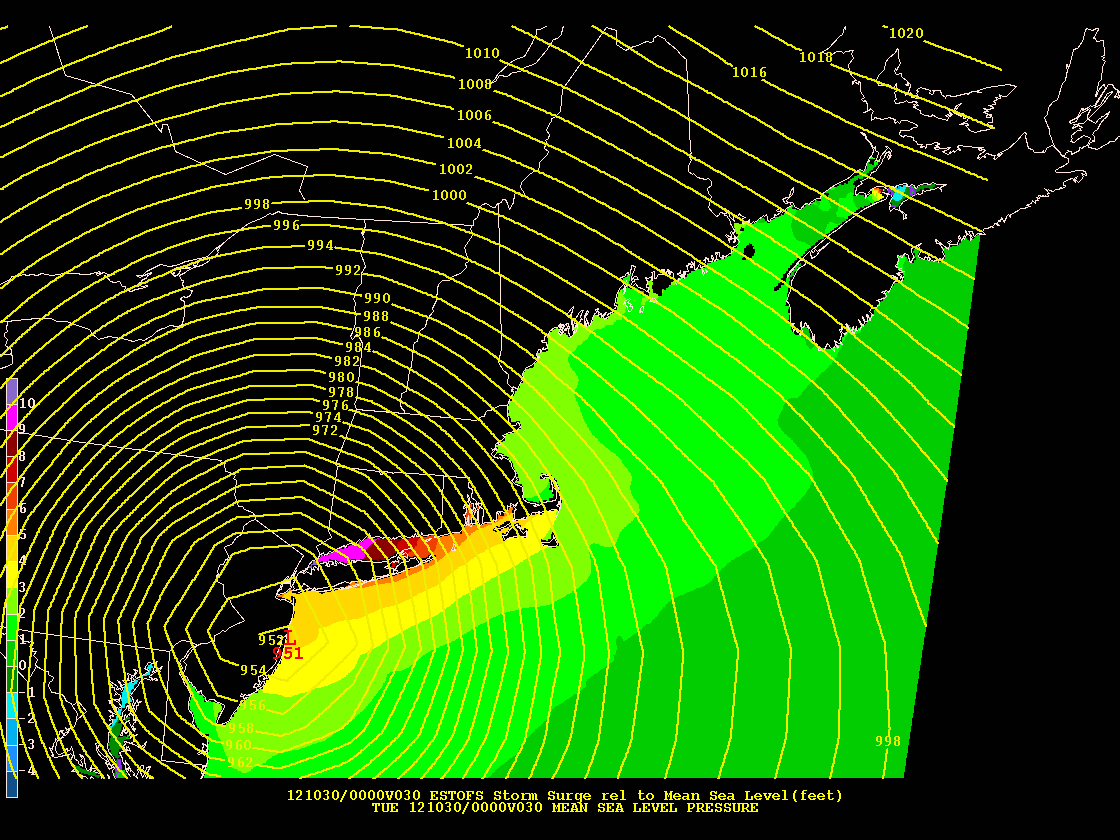
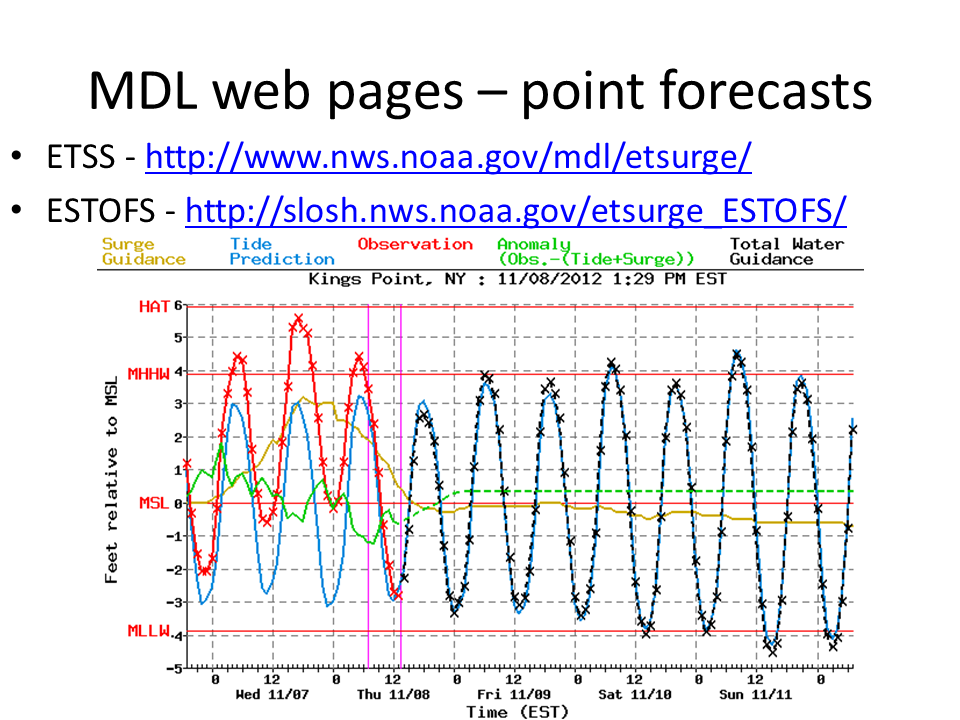
The OPC also produced extratropical storm surge guidance in anticipation of Sandy
transitioning to a post-tropical low. Below are some of the analysis and forecast
products that were issued by the OPC during that time period.
|
| NHC's Official Track of Hurricane Sandy
|
|
 |
 |
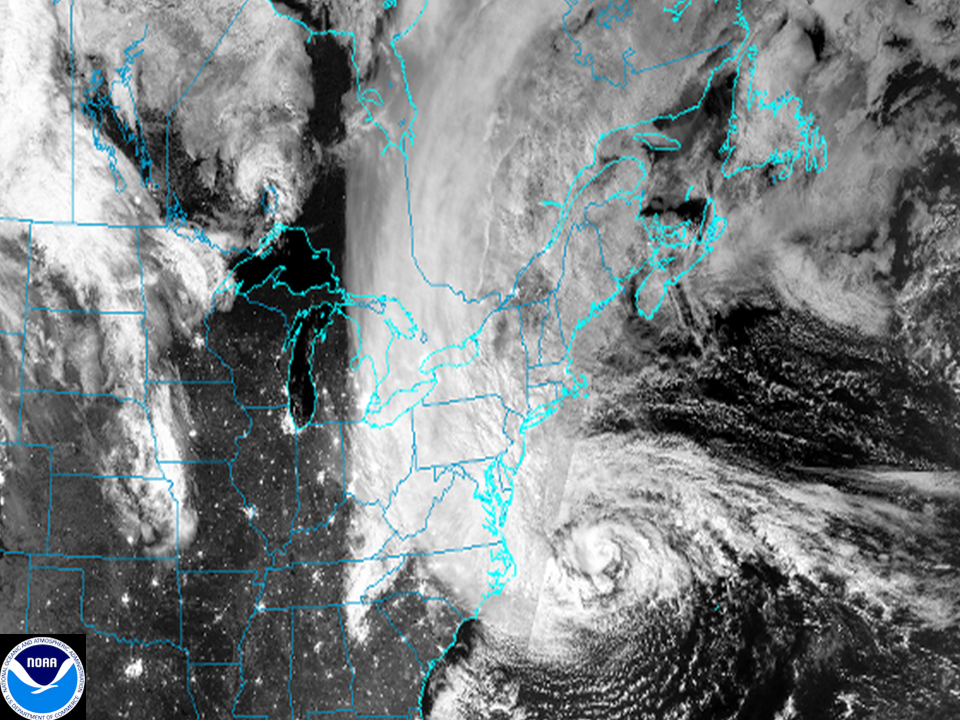
| VIIRS Day-Night Band from overnight October 28, 2012
|
GOES-IR Imagery with Hi-Resolution ASCAT from October 29, 2012 |
| |
|
OPC Analysis Products
| West Atlantic Surface Analysis: Loop
|
|
West Atlantic Wind & Wave Analysis: Loop
|
|
|
|
OPC Text Forecast Products
OPC Graphical Forecast Products
| 24 Hour West Atlantic Surface Forecast: Loop |
|
24 Hour West Atlantic Wind & Wave Forecast: Loop |
| | |
 |
|
 |
| | |
| 48 Hour Atlantic Surface Forecast: Loop |
|
96 Hour Atlantic Surface Forecast: Loop |
| | |
 |
|
 |
| | |
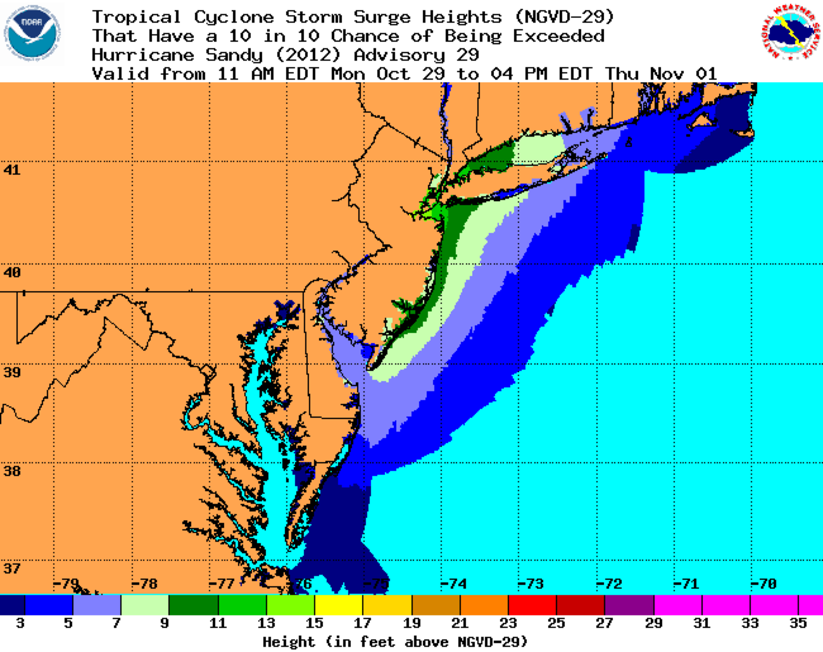
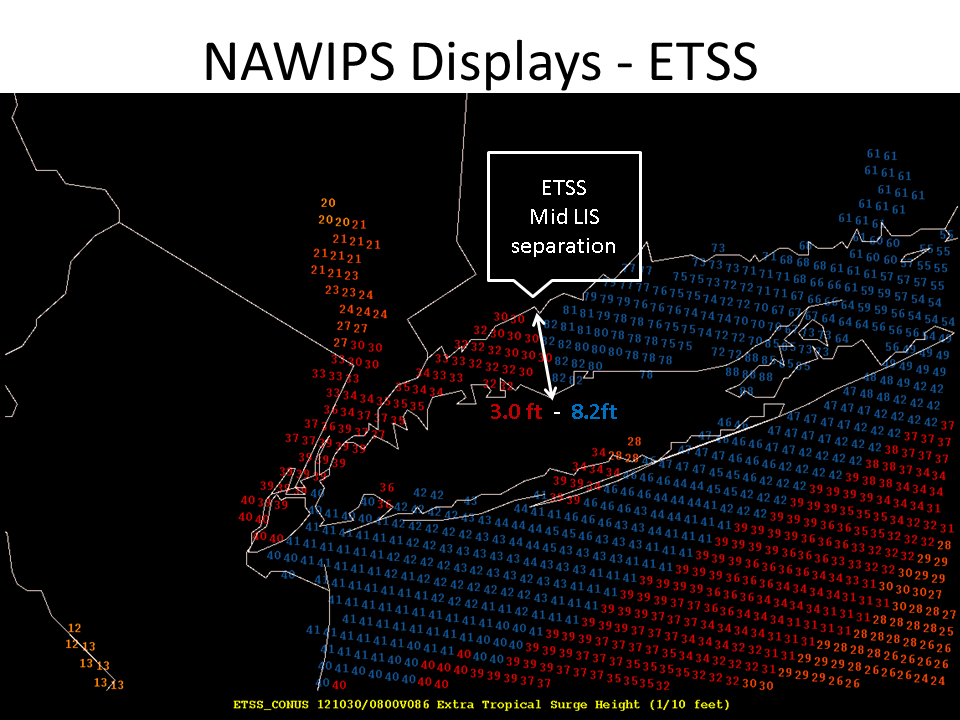
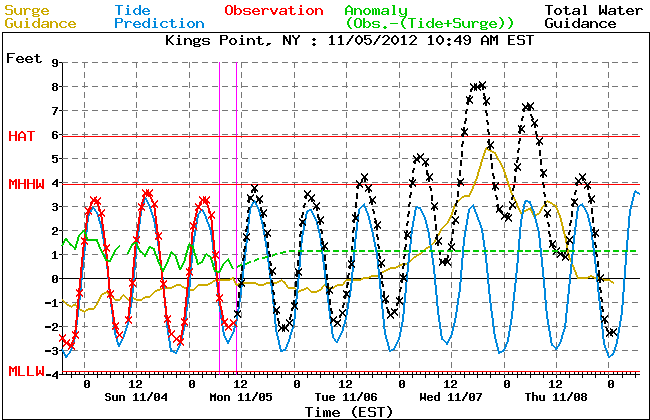
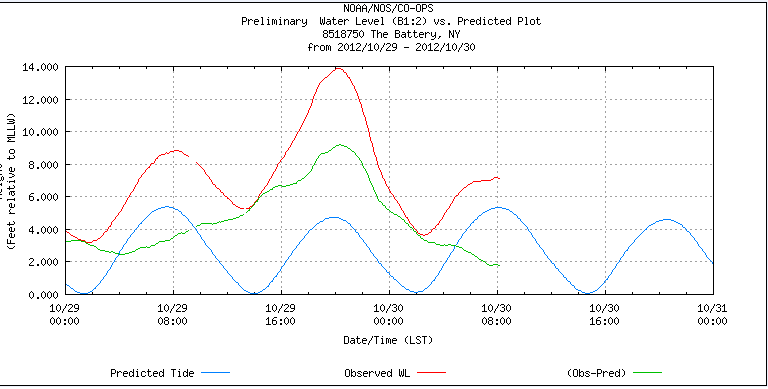
Extratropical Storm Surge Models and Observations
Other Products
| Tropical Cyclone Storm Surge Heights: Loop |
|
Ensemble Cyclone Density Probability: Loop |
| | |
| | |
 |
|
 |
| | |
Other Hurricane Sandy Links
National Offices
|
|
NWS Local Weather Forecast Offices
- WFO, Blacksburg, VA
- WFO, Melbourne, FL
- WFO, Miami, FL
- WFO, Mount Holly, NJ
- WFO, Newport/Morehead City, NC
- WFO, Sterling, VA
- WFO, Tauton, MA
- WFO, Upton, NY
- WFO, Wakefield, VA
- Storm reports from New England - (pdf)
|


