-
Analysis & Forecast
- Weather
- Ocean
- Ice & Icebergs
- Other Hazards
-
Data
- Digital Forecasts
- Electronic Marine Charting (ECDIS)
- Environmental
- Freezing Spray
- GIS
- Observations
- Ocean
- Past Weather
- Probabilistic Guidance
-
Information
- Product Information
- Receiving Products
- About OPC
-
Social Media
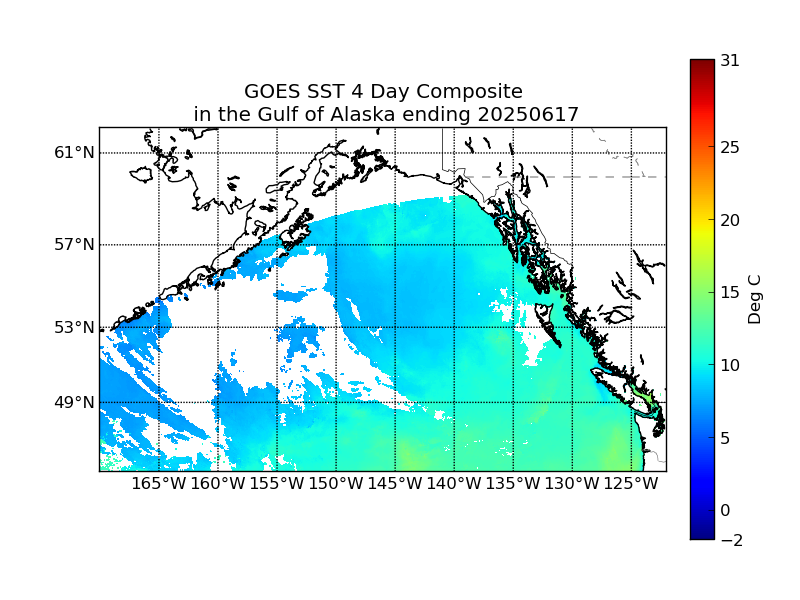
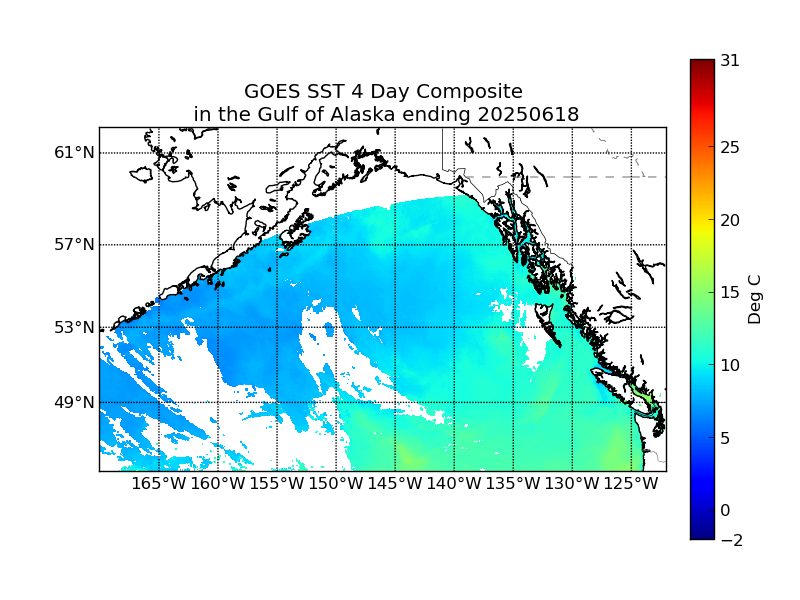
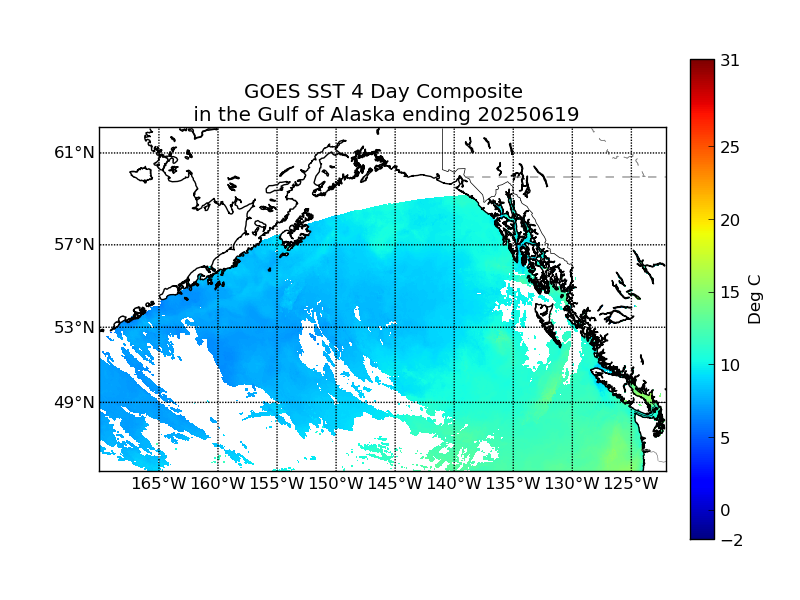
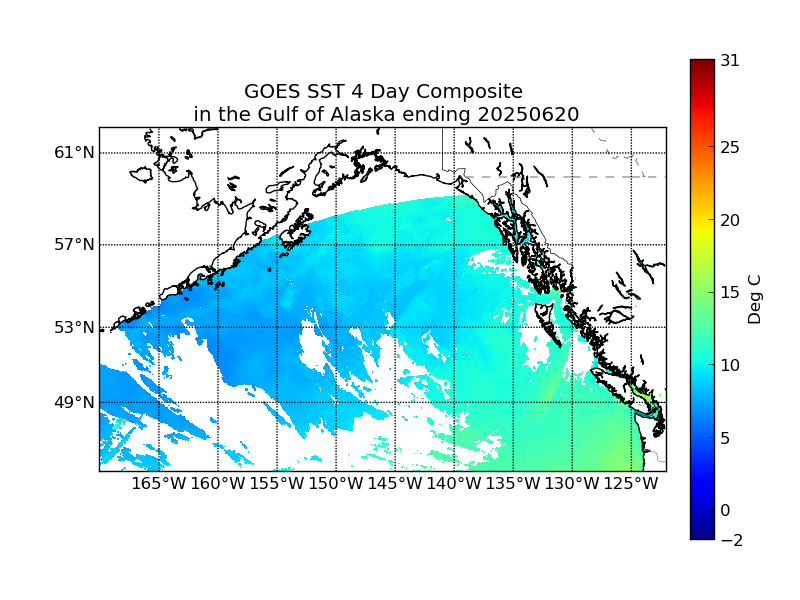
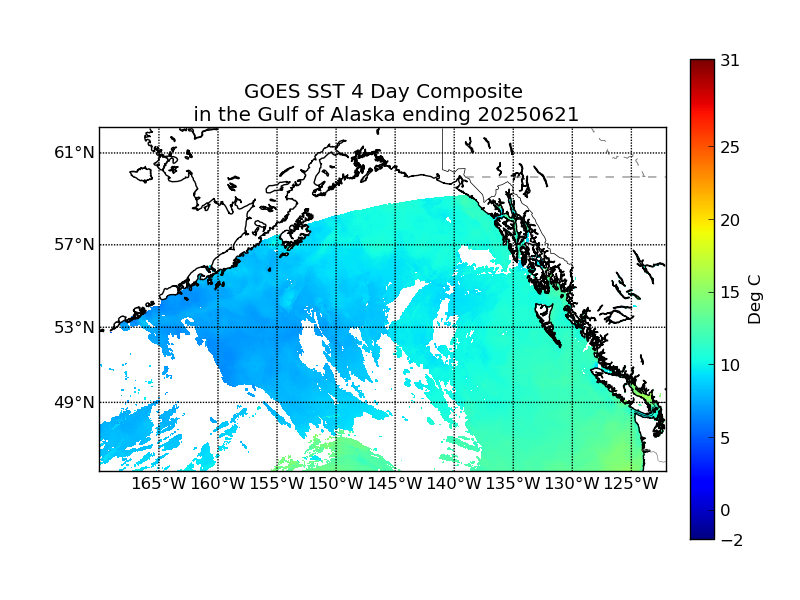
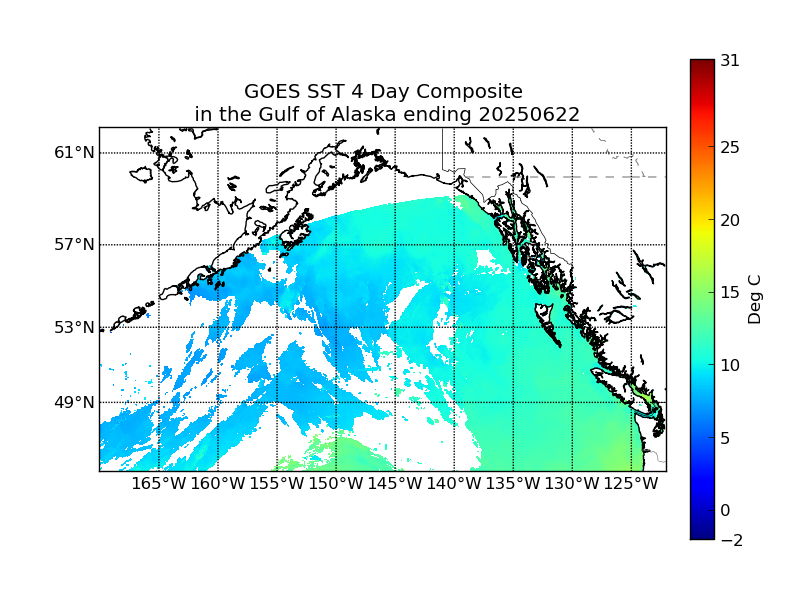
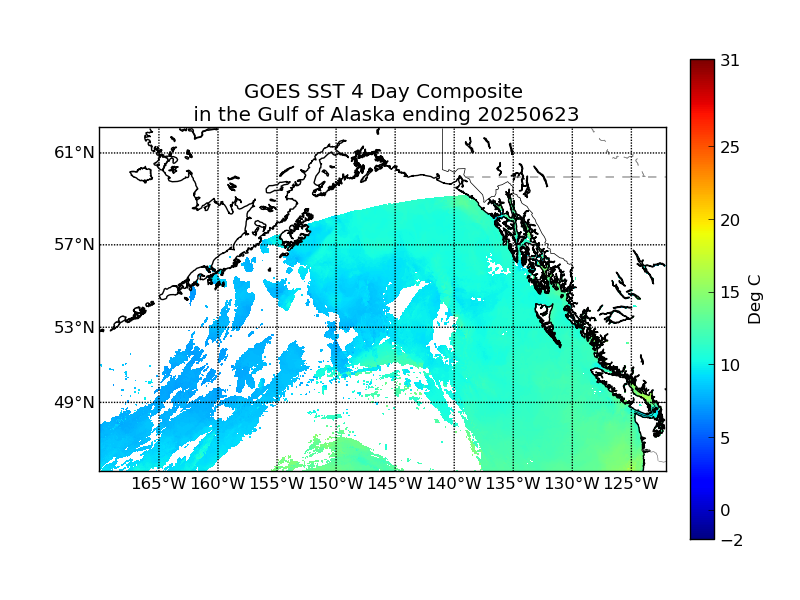
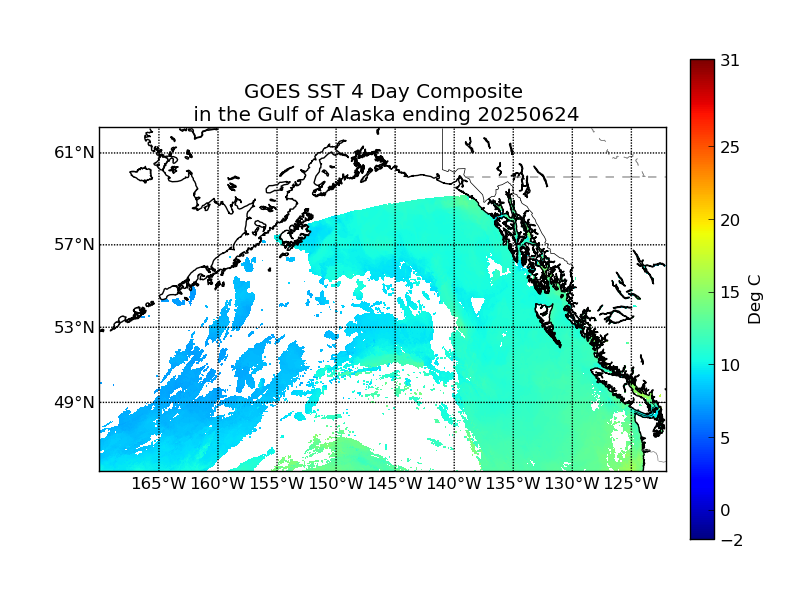
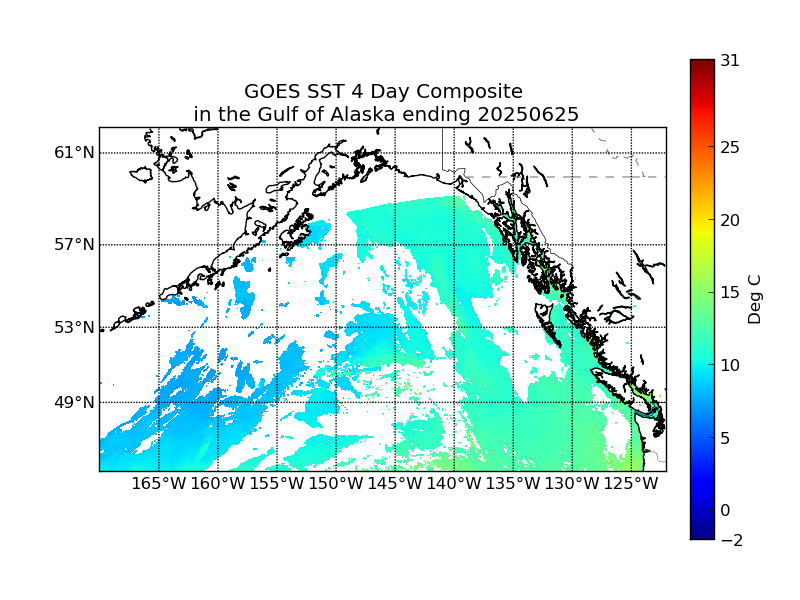
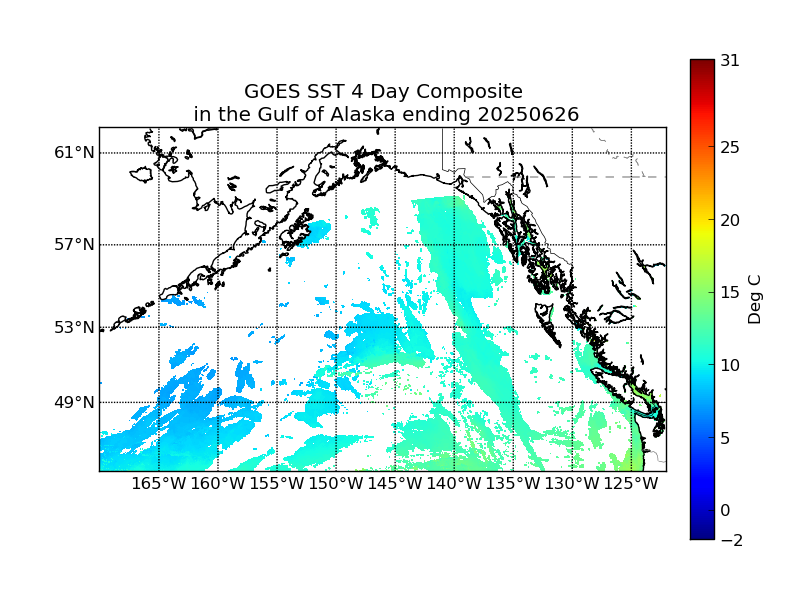
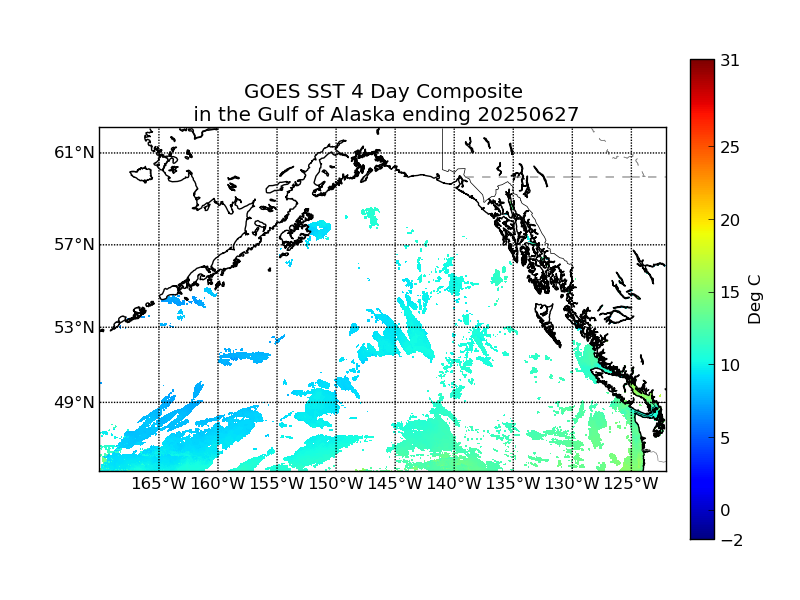
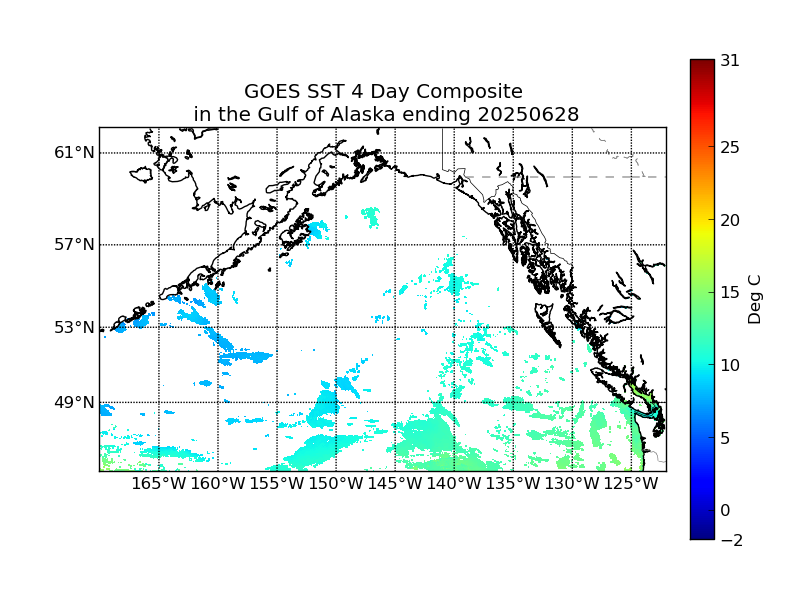
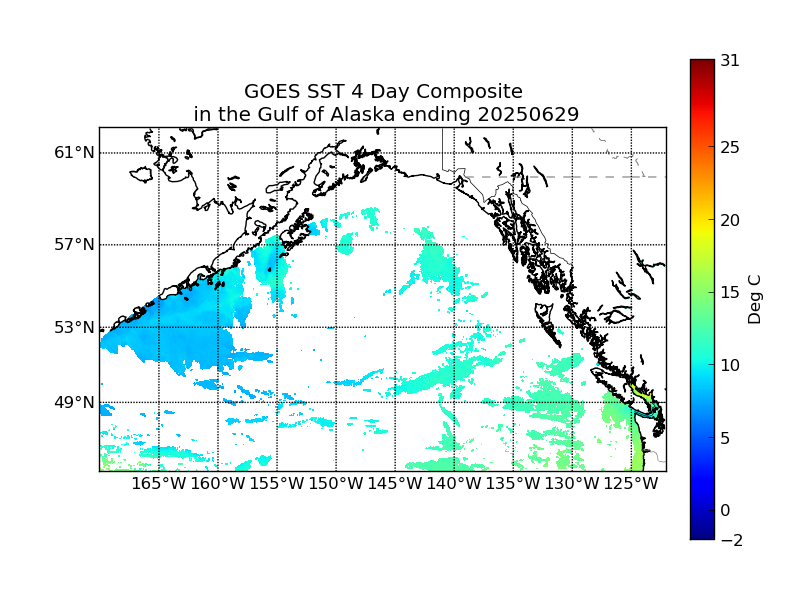
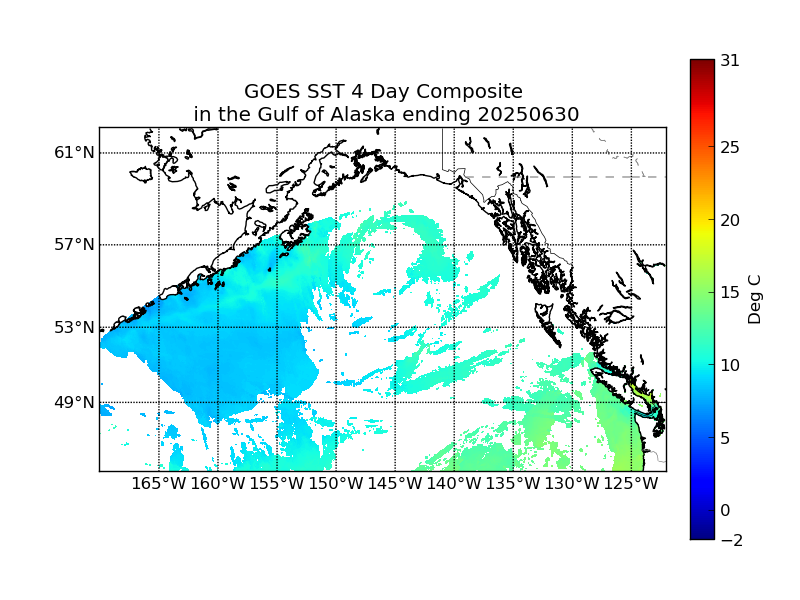
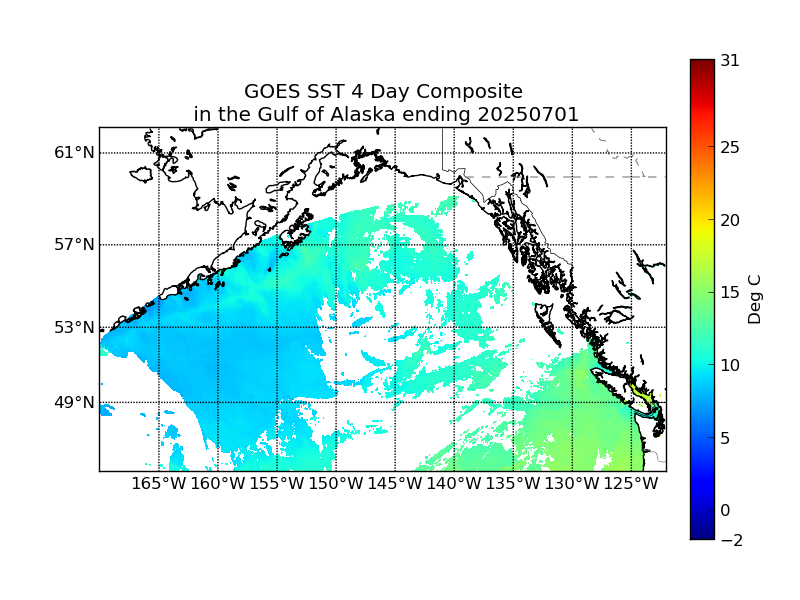
GOES Satellite-Derived Sea Surface Temperatures
|
PLEASE NOTE: The GOES East regions are currently not available while graphics are being developed for the new GOES 19 satellite.
|
Use the drop down menus below to change the display.
- Data:
GOES Satellite-Derived Sea Surface Temperatures
- Area:
Gulf of Alaska
- Parameters:
4 Day Avg Composite
- Loop:
Off