


Alaska Pacific Ocean RADIOFAX Schedule
Products listed on this page are provided by the Ocean Prediction Center and the National Weather Service Forecast Office in Anchorage, Alaska. The forecast area includes the North Pacific Alaska offshore and high seas waters. The products listed on this page are transmitted via high frequency (HF) through transmitters of the United States Coast Guard from Kodiak, Alaska. The shortwave HF signal is decoded by Weather FAX receivers onboard ships in the forecast area. The broadcast frequencies are listed below.
NOTE: If you are interested in printing the marine weather charts listed on this page a TIFF viewer produces the best results. The GIF marine weather charts are colored and have a black background.
Time delay of analysis products: Graphic analysis/forecast charts broadcast by radiofacsimile are available by broadcast time and are usually available 15 minutes prior to broadcast.
Information on key terms & symbols used on charts.
NOAA National Weather Service Washington, D.C.
Radiofacsimile Schedule Transmitted Via
U.S.C.G. Kodiak, Alaska (NOJ)
19 September 2018
Assigned Frequencies(KHZ): Day = 2054, 4298, 8459, 12412.5 kHz
For Carrier Frequency Subtract 1.9 kHz
The current GMT/UTC/Zulu time is:
Additional Schedule Formats: Print — Product Links
Additional Broadcasts: Point Reyes, CA — Honolulu, HI — Worldwide (pdf)
Note: The FTPmail program retrieves text messages and charts from an ftp server maintained by the National Weather Service. It will retrieve any marine products available from any National Weather Service office. IDs for the products in this radiofax broadcast are listed in the table below.
| Time | Chart | FTPMAIL ID | Graphic Format | Last Update |
|---|---|---|---|---|
| 0340Z | Test Pattern | TIF|GIF|B/W GIF | ||
| 0343Z | Sea Ice Analysis | PTCA89 | TIF|GIF|B/W GIF | |
| 0403Z | 00Z Surface Analysis (40N-70N, 125W-150E) | PYCA00 | TIF|GIF|B/W GIF | |
| 0427Z | Retransmit 2203Z: 24Hr Surface/Ice Accretion VT 12Z (20N-70N, 115W-135E) | PPBE01 | TIF|GIF|B/W GIF | 17:55Z Jul 31 2026 |
| 0437Z | Retransmit 2227Z: 48Hr Surface/Ice Accretion VT 12Z (20N-70N, 115W-135E) | PWBI99 | TIF|GIF|B/W GIF | 17:18Z Jul 31 2026 |
| 0447Z | Retransmit 2348Z: 96Hr Surface/Ice Accretion VT 12Z (20N-70N, 115W-135E) | PWBM99 | TIF|GIF|B/W GIF | 14:31Z Jun 01 2026 |
| 0456Z | 00Z Sea State Analysis (20N-70N, 115W-135E) | PJBA99 | TIF|GIF|B/W GIF | 01:55Z Aug 01 2026 |
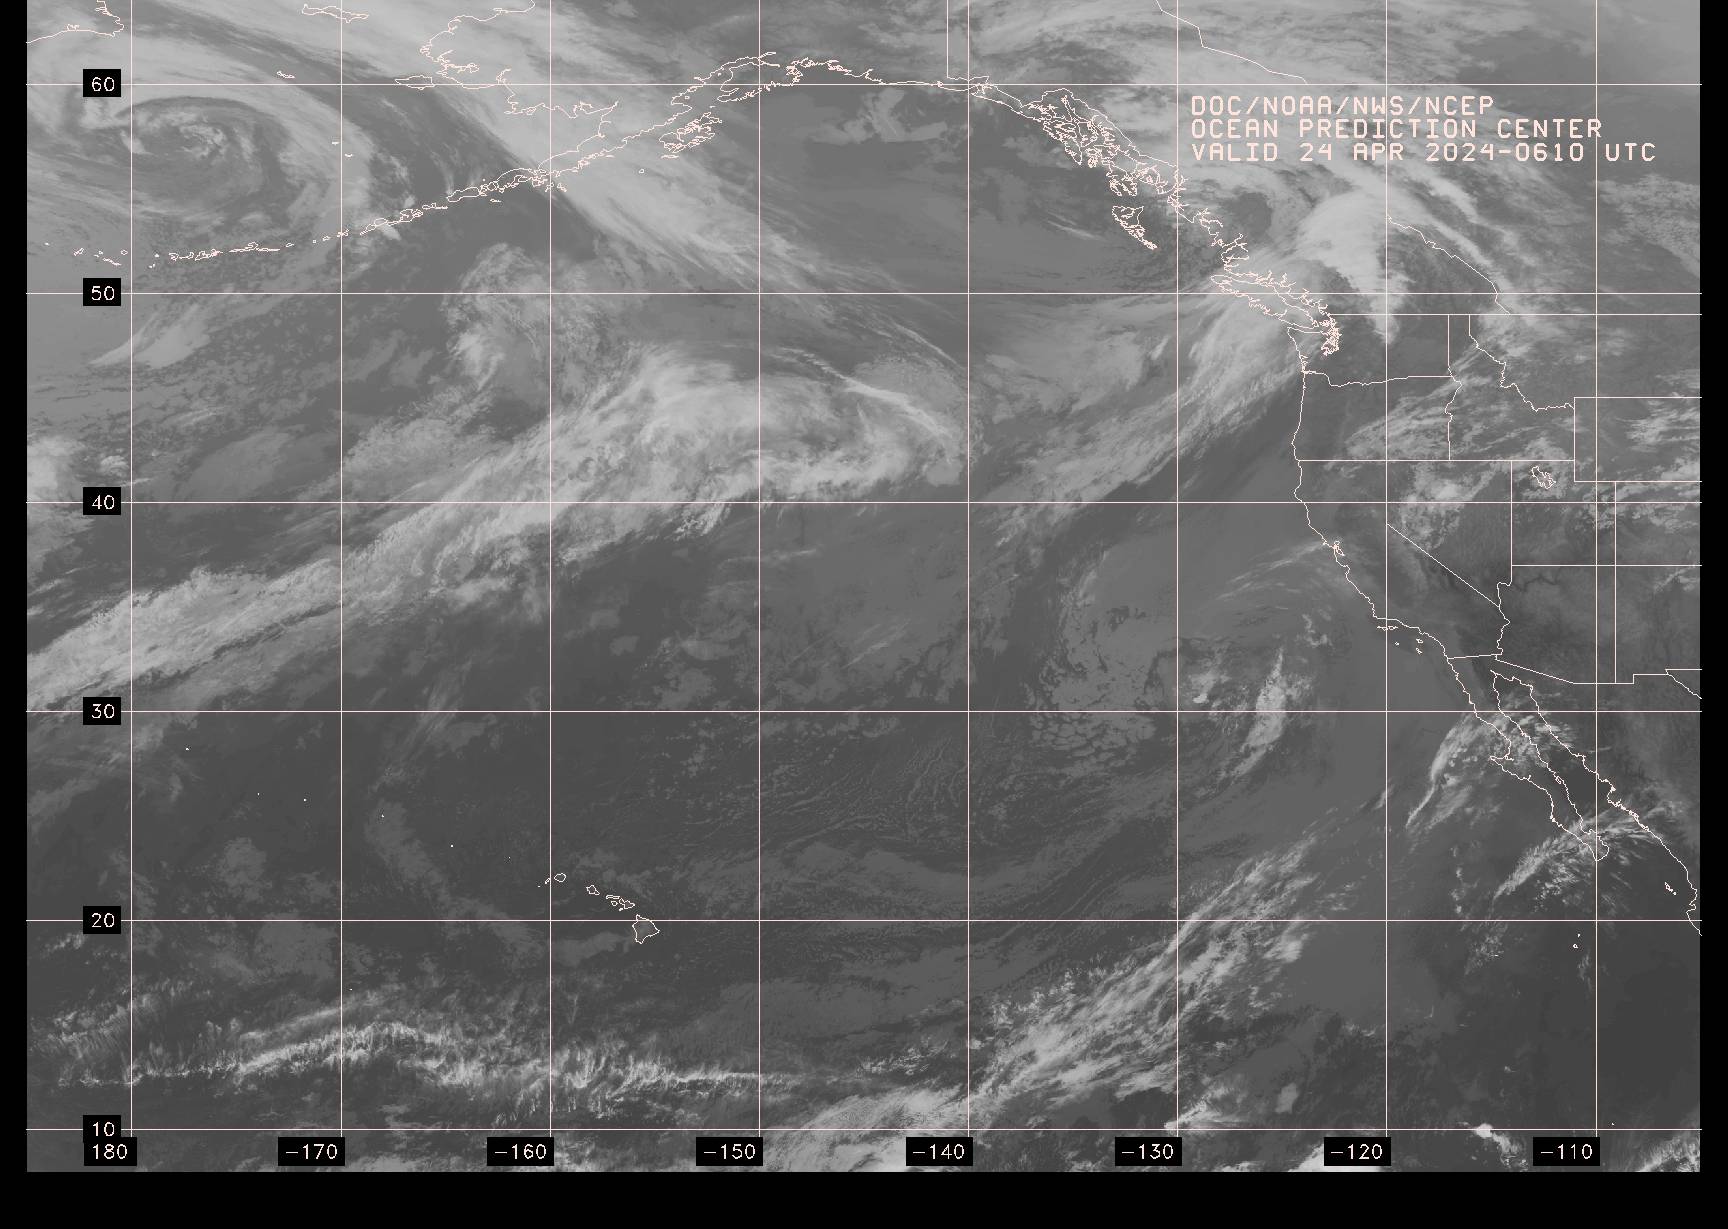
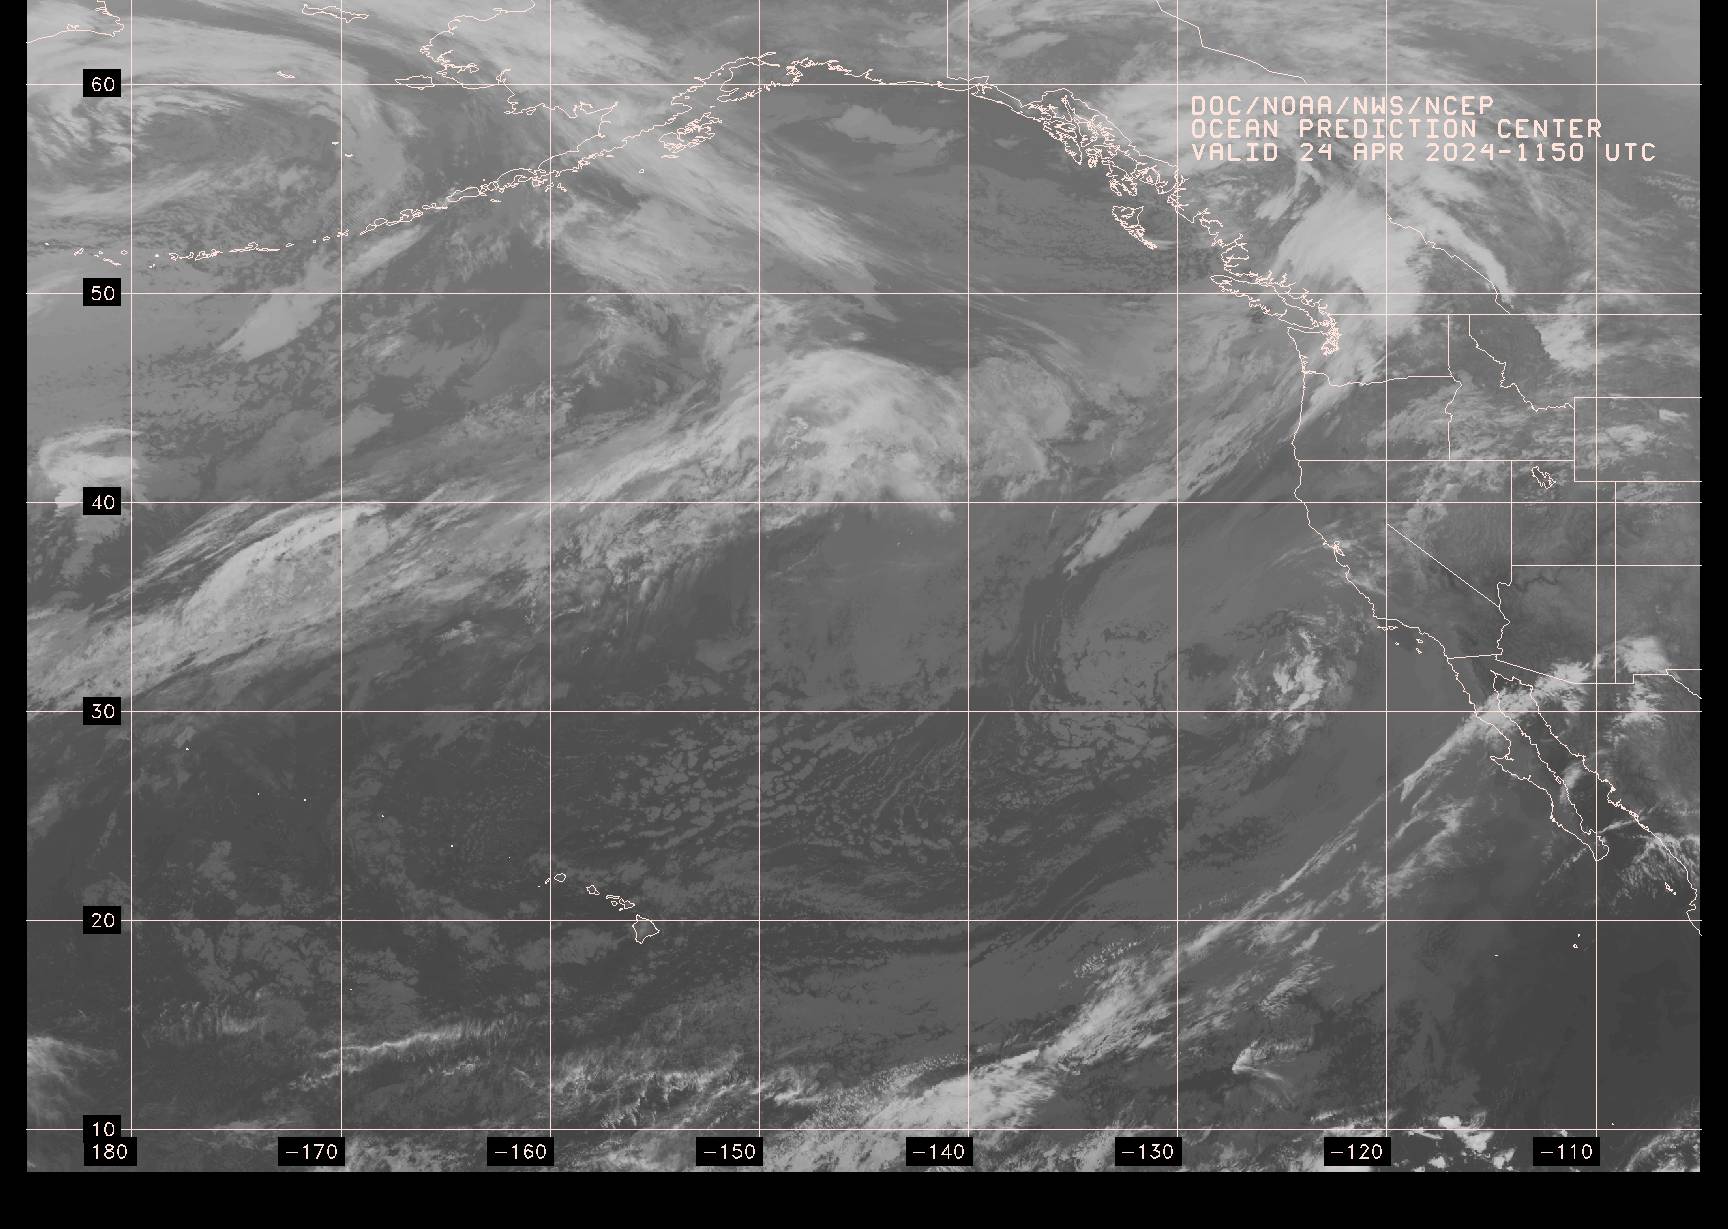
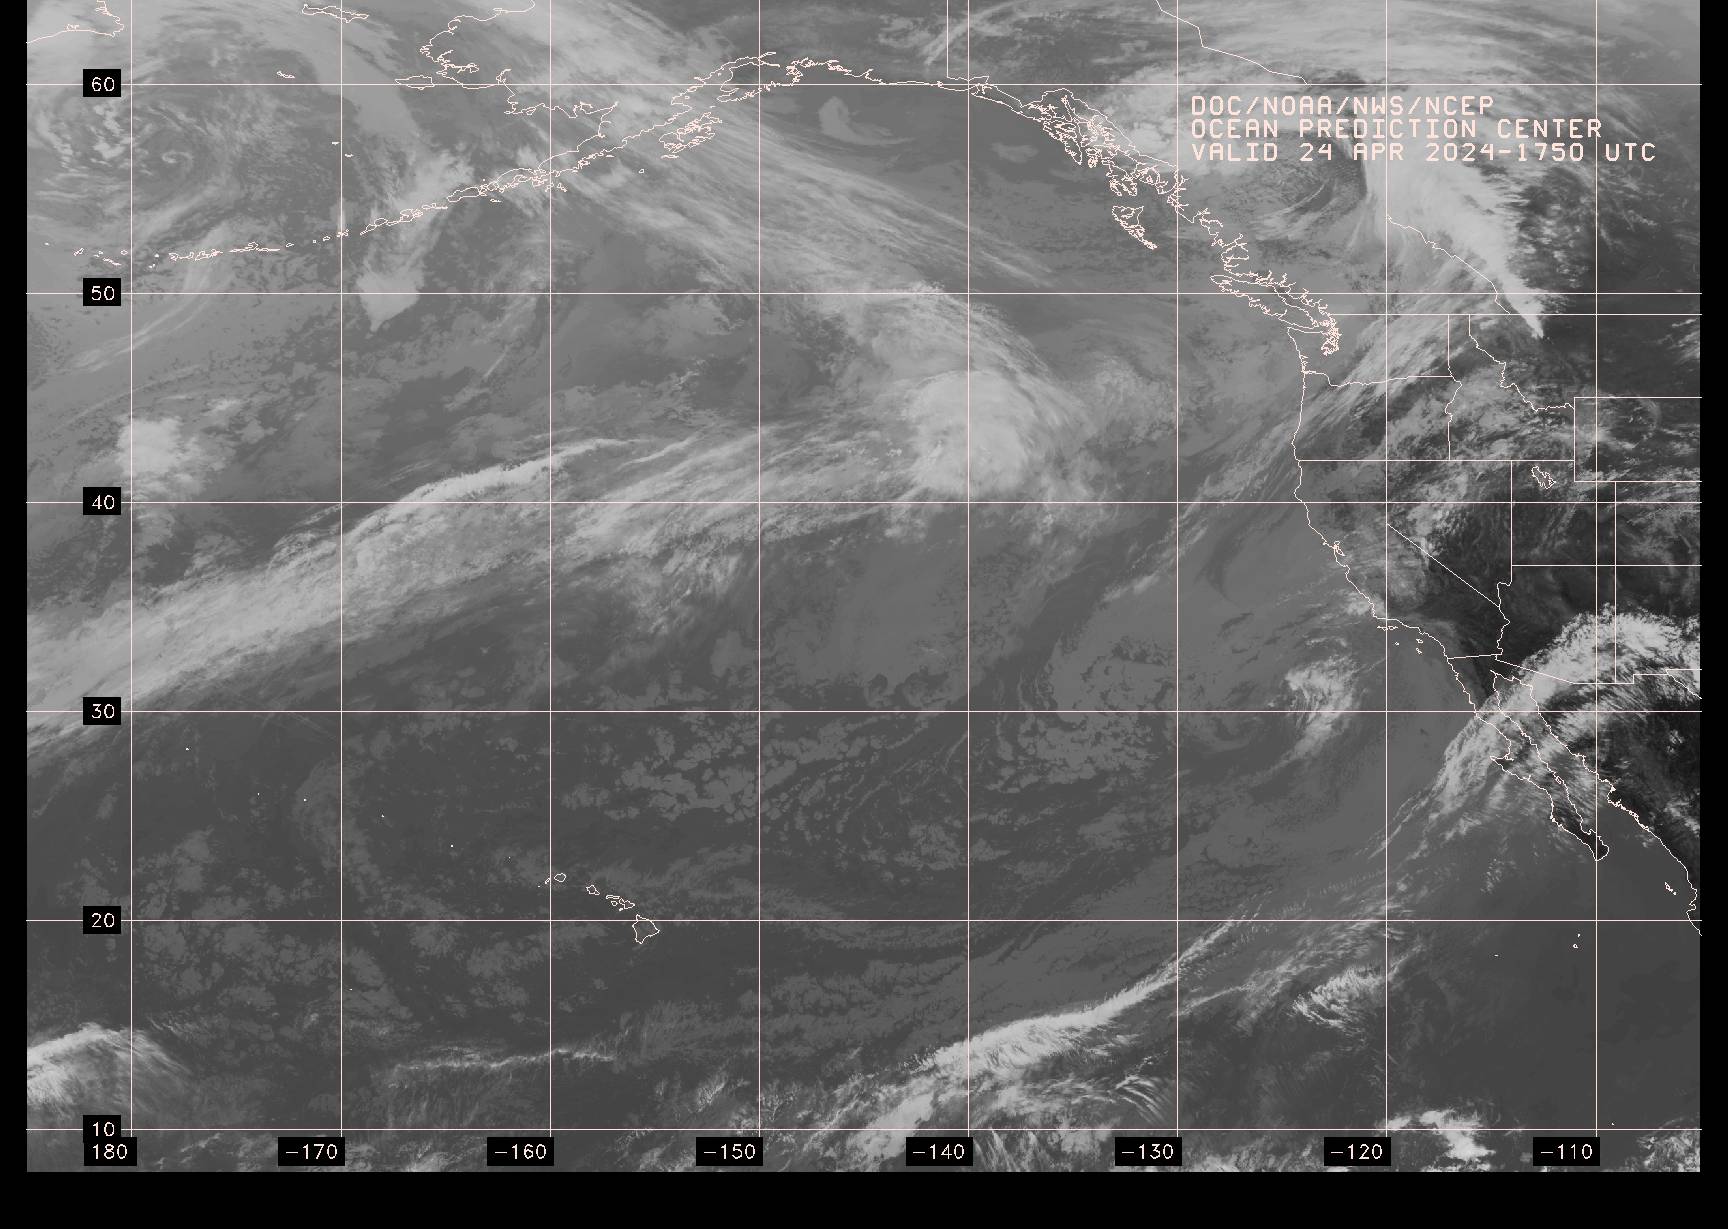
| 0506Z | Satellite Picture (05N-55N, East of 180) | EVPN01 | JPG | 00:30Z Aug 01 2026 |
| 0517Z | 00Z 500mb Analysis (20N-70N, 115W-135E) | PPBA50 | TIF|GIF|B/W GIF | 02:16Z Aug 01 2026 |
| 0527Z | Symbols and Abbreviations | PLBZ06 | TIF|GIF|B/W GIF | |
| 0548Z | Request For Comments | TIF|GIF|B/W GIF | ||
| 0558Z | 24Hr 500mb VT 00Z (20N-70N, 115W-135E) | PPBE50 | TIF|GIF|B/W GIF | 05:29Z Aug 01 2026 |
| 0950Z | Test Pattern | TIF|GIF|B/W GIF | ||
| 0953Z | 06Z Surface Analysis (40N-70N, 125W-150E) | PYCA01 | TIF|GIF|B/W GIF | |
| 1017Z | 24Hr Surface/Ice Accretion VT 00Z (20N-70N, 115W-135E) | PPBE00 | TIF|GIF|B/W GIF | 05:57Z Aug 01 2026 |
| 1027Z | 24Hr Wind&Wave VT 00Z (20N-70N, 115W-135E) | PWBE98 | TIF|GIF|B/W GIF | 06:22Z Aug 01 2026 |
| 1037Z | 48Hr Surface/Ice Accretion VT 00Z (20N-70N, 115W-135E) | PWBI98 | TIF|GIF|B/W GIF | 06:53Z Aug 01 2026 |
| 1047Z | 48Hr Wind&Wave VT 00Z (20N-70N, 115W-135E) | PJBI98 | TIF|GIF|B/W GIF | |
| 1057Z | 5-Day Sea Ice Forecast | PTCO89 | TIF|GIF|B/W GIF | |
| 1117Z | Satellite Picture (05N-55N, East of 180) | EVPN06 | JPG | 06:30Z Aug 01 2026 |
| 1128Z | 48Hr Peak Wave Period&Direction VT 00Z (20N-70N, 115W-135E) | PJBI88 | TIF|GIF|B/W GIF | 04:16Z Aug 01 2026 |
| 1138Z | 48Hr 500mb VT 00Z (20N-70N, 115W-135E) | PPBI50 | TIF|GIF|B/W GIF | 05:29Z Aug 01 2026 |
| 1148Z | Sea Surface Temperature Analysis (40N-60N, 125W-160E) | PTCA88 | TIF|GIF|B/W GIF | |
| 1159Z | Cook Inlet Sea Ice Forecast | PTCA87 | TIF|GIF|B/W GIF | |
| 1540Z | Test Pattern | TIF|GIF|B/W GIF | ||
| 1543Z | Retransmit 1057Z: 5-Day Sea Ice Forecast | PTCO89 | TIF|GIF|B/W GIF | |
| 1603Z | 12Z Surface Analysis (40N-70N, 125W-150E) | PYCA02 | TIF|GIF|B/W GIF | |
| 1627Z | Retransmit 1017Z: 24Hr Surface/Ice Accretion VT 00Z (20N-70N, 115W-135E) | PPBE00 | TIF|GIF|B/W GIF | 05:57Z Aug 01 2026 |
| 1637Z | Retransmit 1037Z: 48Hr Surface/Ice Accretion VT 00Z (20N-70N, 115W-135E) | PWBI98 | TIF|GIF|B/W GIF | 06:53Z Aug 01 2026 |
| 1647Z | Retransmit 2348Z: 96Hr Surface/Ice Accretion VT 12Z (20N-70N, 115W-135E) | PWBM99 | TIF|GIF|B/W GIF | 14:31Z Jun 01 2026 |
| 1656Z | Retransmit 0456: 00Z Sea State Analysis (20N-70N, 115W-135E) | PJBA99 | TIF|GIF|B/W GIF | 01:55Z Aug 01 2026 |
| 1706Z | Satellite Picture (05N-55N, East of 180) | EVPN12 | JPG | 12:30Z Jul 31 2026 |
| 1717Z | 12Z 500mb Analysis (20N-70N, 115W-135E) | PBBA51 | TIF|GIF|B/W GIF | 14:16Z Jul 31 2026 |
| 1727Z | Schedule | PLBZ05 | TIF|GIF|B/W GIF | |
| 1748Z | Product Notice | TIF|GIF|B/W GIF | ||
| 1758Z | 24Hr 500mb VT 12Z (20N-70N, 115W-135E) | PPBE51 | TIF|GIF|B/W GIF | 17:29Z Jul 31 2026 |
| 1808Z | 48Hr 500mb VT 12Z (20N-70N, 115W-135E) | PPBI51 | TIF|GIF|B/W GIF | 17:29Z Jul 31 2026 |
| 2150Z | Test Pattern | TIF|GIF|B/W GIF | ||
| 2153Z | 18Z Surface Analysis (40N-70N, 125W-150E) | PYCA03 | TIF|GIF|B/W GIF | |
| 2203Z | 24Hr Surface/Ice Accretion VT 12Z (20N-70N, 115W-135E) | PPBE01 | TIF|GIF|B/W GIF | 17:55Z Jul 31 2026 |
| 2217Z | 24Hr Wind&Wave VT 12Z (20N-70N, 115W-135E) | PWBE99 | TIF|GIF|B/W GIF | 18:31Z Jul 31 2026 |
| 2227Z | 48Hr Surface/Ice Accretion VT 12Z (20N-70N, 115W-135E) | PWBI99 | TIF|GIF|B/W GIF | 17:18Z Jul 31 2026 |
| 2237Z | 48Hr Wind&Wave VT 12Z (20N-70N, 115W-135E) | PJBI99 | TIF|GIF|B/W GIF | 17:19Z Jul 31 2026 |
| 2247Z | 48Hr Peak Wave Period&Direction VT 12Z (20N-70N, 115W-135E) | PJBI89 | TIF|GIF|B/W GIF | 16:16Z Jul 31 2026 |
| 2257Z | Retransmit 0343Z: Sea Ice Analysis | PTCA89 | TIF|GIF|B/W GIF | |
| 2307Z | Satellite Picture (05N-55N, East of 180) | EVPN18 | JPG | 18:30Z Jul 31 2026 |
| 2317Z | 72Hr Surface/Ice Accretion VT 12Z (20N-70N, 115W-135E) | PPBK98 | TIF|GIF|B/W GIF | 17:15Z Jun 01 2026 |
| 2328Z | 72Hr Wind&Wave VT 12Z (20N-70N, 115W-135E) | PJBK88 | TIF|GIF|B/W GIF | 18:48Z Jul 31 2026 |
| 2338Z | 72Hr Peak Wave Period&Direction VT 12Z (20N-70N, 115W-135E) | PKBK88 | TIF|GIF|B/W GIF | 16:17Z Jul 31 2026 |
| 2348Z | 96Hr Surface/Ice Accretion VT 12Z (20N-70N, 115W-135E) | PWBM99 | TIF|GIF|B/W GIF | 14:31Z Jun 01 2026 |
| 2358Z | 96Hr Wind&Wave VT 12Z (20N-70N, 115W-135E) | PJBM98 | TIF|GIF|B/W GIF | 18:56Z Jul 31 2026 |
| 0008Z | 96Hr Peak Wave Period&Direction VT 12Z (20N-70N, 115W-135E) | PJBM88 | TIF|GIF|B/W GIF | 16:18Z Jul 31 2026 |
| 0018Z | 96Hr 500mb VT 12Z (20N-70N, 115W-135E) | PPBM50 | TIF|GIF|B/W GIF | 17:31Z Jul 31 2026 |
Abbreviations: VT=VALID TIME, Hr=Hour
Comments on this schedule or quality of charts are invited.