


| Hurricane Warnings in Effect | Pacific: High Seas EP1 and EPI |
Atlantic Ocean RADIOFAX Schedule
Products listed on this page are provided by the Ocean Prediction Center and the National Hurricane Center (denotied with **). The forecast area includes the North Atlantic and some Tropcial offshore and high seas waters. The products are transmitted via high frequency (HF) through transmitters of the United States Coast Guard from Boston, Massachusetts. The HF shortwave signal is decoded by Weather FAX receivers onboard ships in the forecast area. The broadcast frequencies are listed below.
Time delay of analysis products: Graphic analysis/forecast charts broadcast by radiofacsimile are available by broadcast time and are usually available 15 minutes prior to broadcast.
Information on key terms & symbols used on charts.
NOAA National Weather Service Washington, D.C.
Radiofacsimile Schedule transmitted via U.S.C.G. Boston, Massachusetts (NMF)
19 September 2018
Assigned Frequencies (KHZ):
Day = 6340.5,9110,12750
Night= 4235, 6340.5, 9110, 12750
The current GMT/UTC/Zulu time is:
Additional Schedule Formats: Print — Product Links
Additional Broadcasts: New Orleans, LA — Worldwide (pdf)
*Tropical Cyclone Danger Area chart replaced by High Wind&Wave Warning chart from December 1 - May 15th.
Note: The FTPmail program retrieves text messages and charts from an ftp server maintained by the National Weather Service. It will retrieve any marine products available from any National Weather Service office. IDs for the products in this radiofax broadcast are listed in the table below.
| Time | Chart | FTPMAIL ID | Graphic Format | Last Update |
|---|---|---|---|---|
| 0230Z | Test Pattern | PZZZ94 | ||
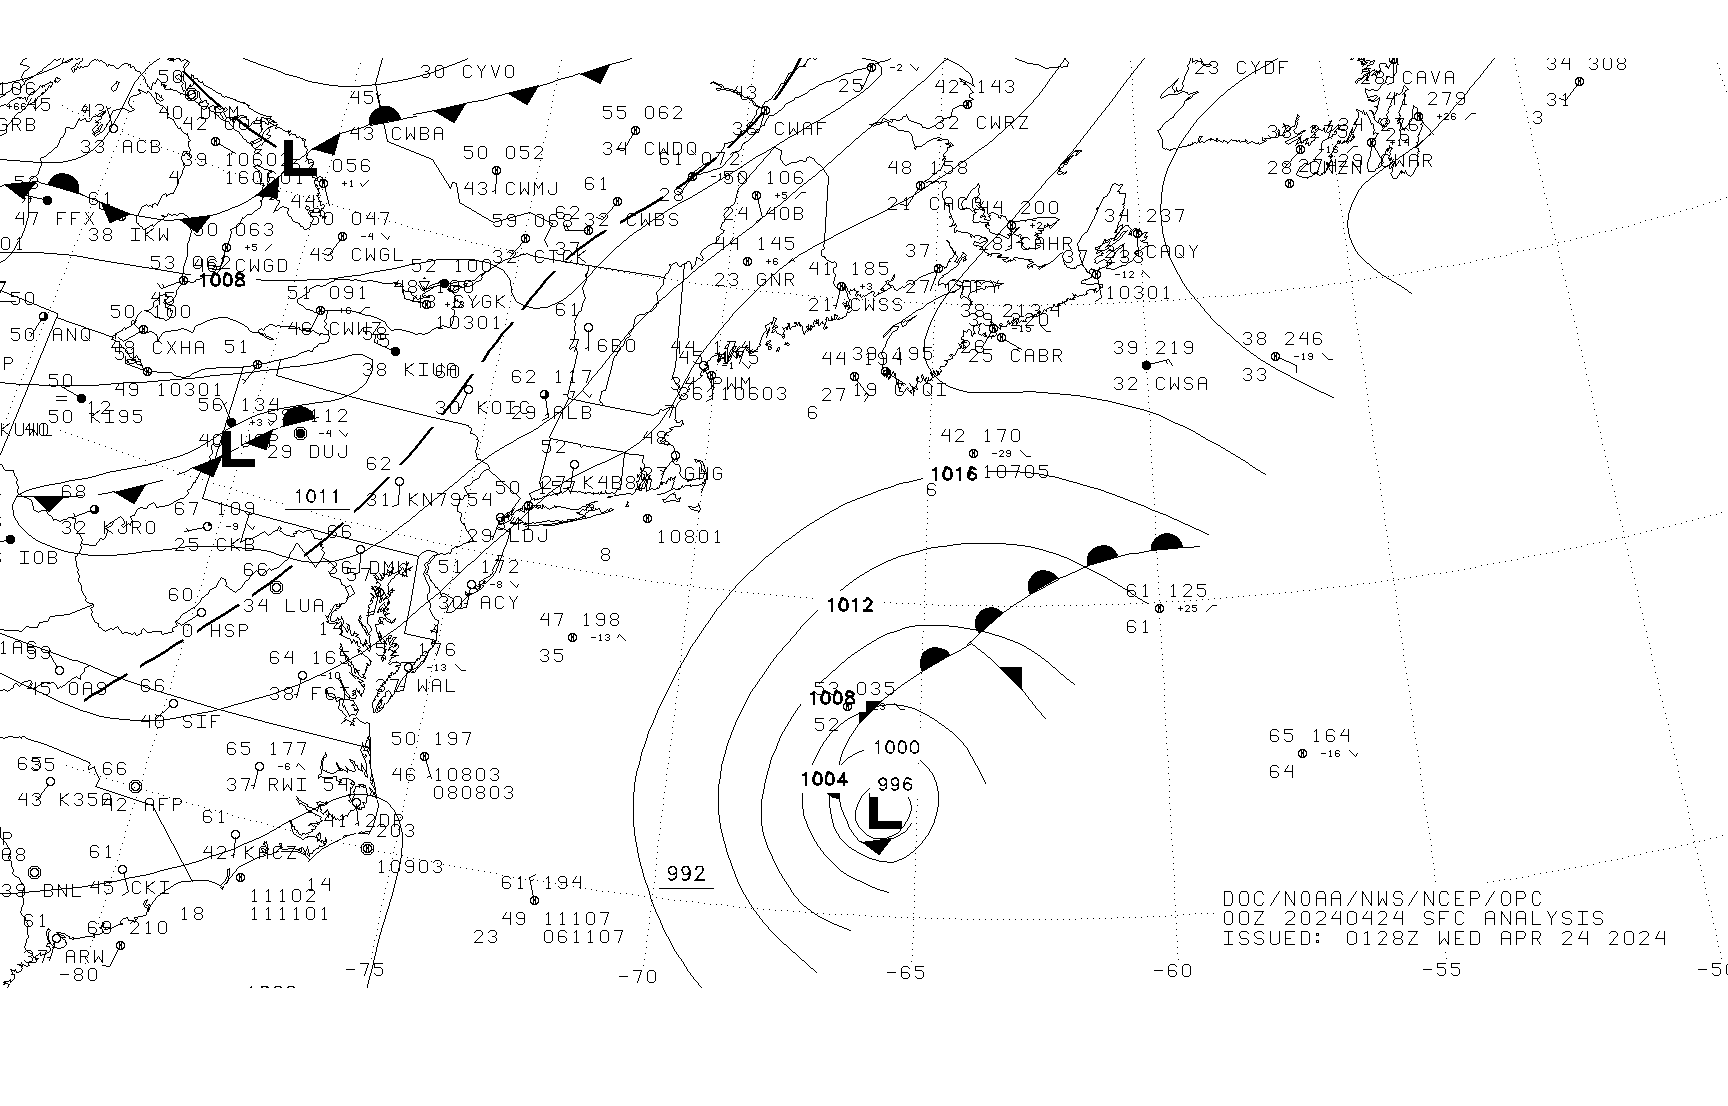
| 0233Z | 00Z Preliminary Surface Analysis (28N-52N, 45W-85W) | PYAA10 | TIF|GIF|B/W GIF | |
| 0243Z | Schedule Part 1 | PLAZ01 | ||
| 0254Z | Schedule Part 2 | PLAZ02 | ||
| 0305Z | Request For Comments | PLAZ03 | ||
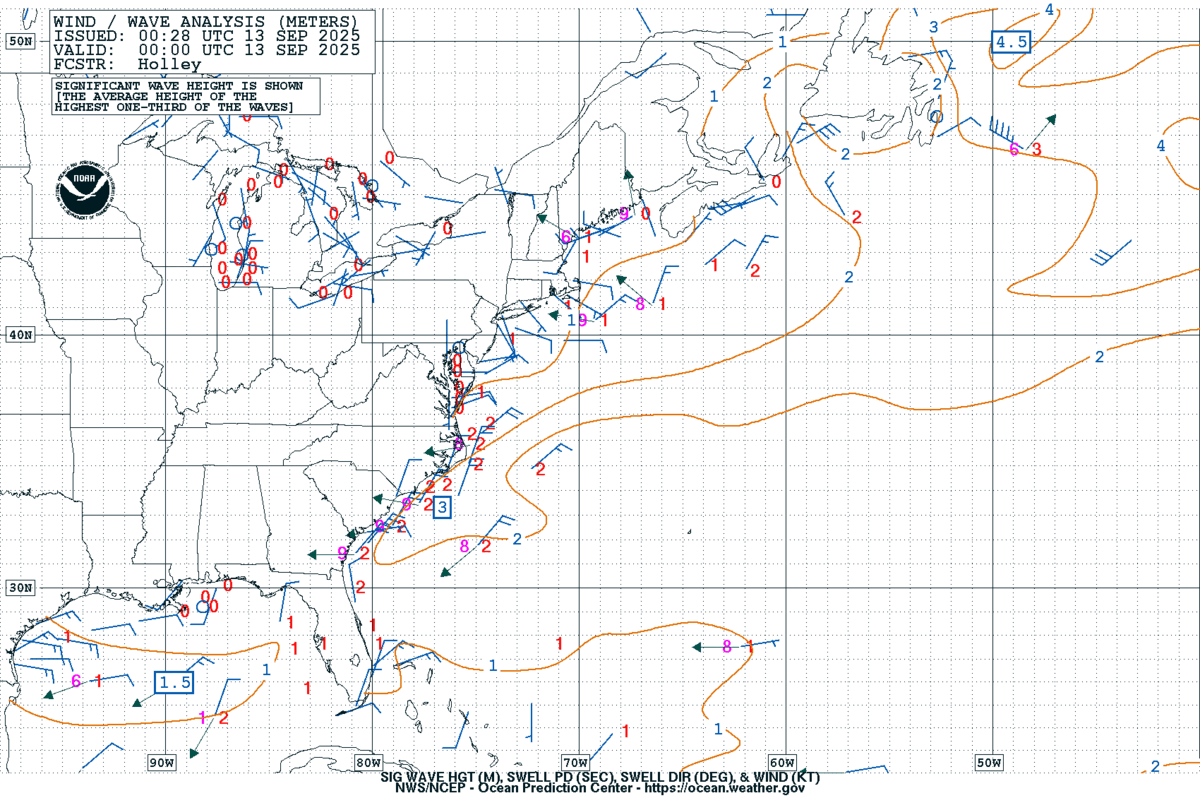
| 0315Z | 00Z Wind&Wave Analysis (22N-51N, 40W-98W) | PWAA88 | TIF|GIF|B/W GIF | 01:38Z Jul 20 2026 |
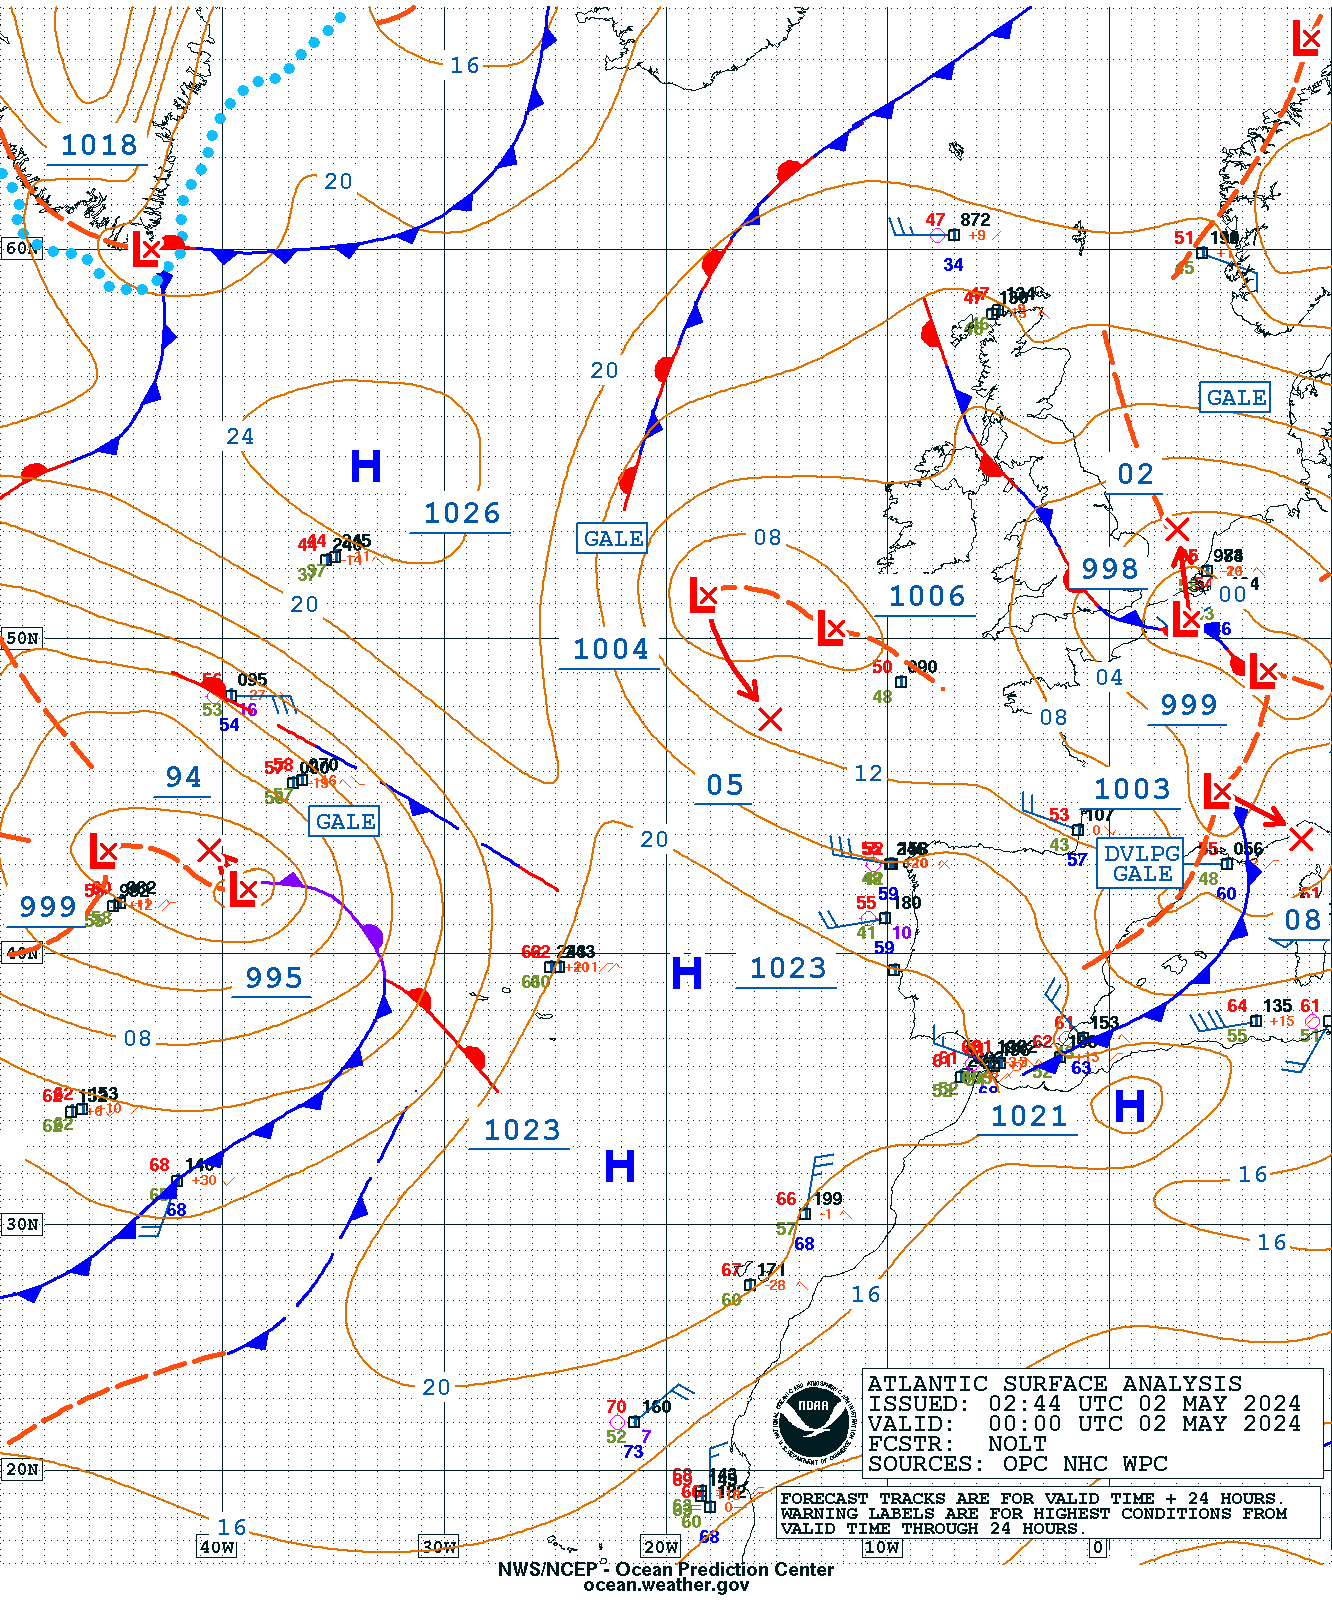
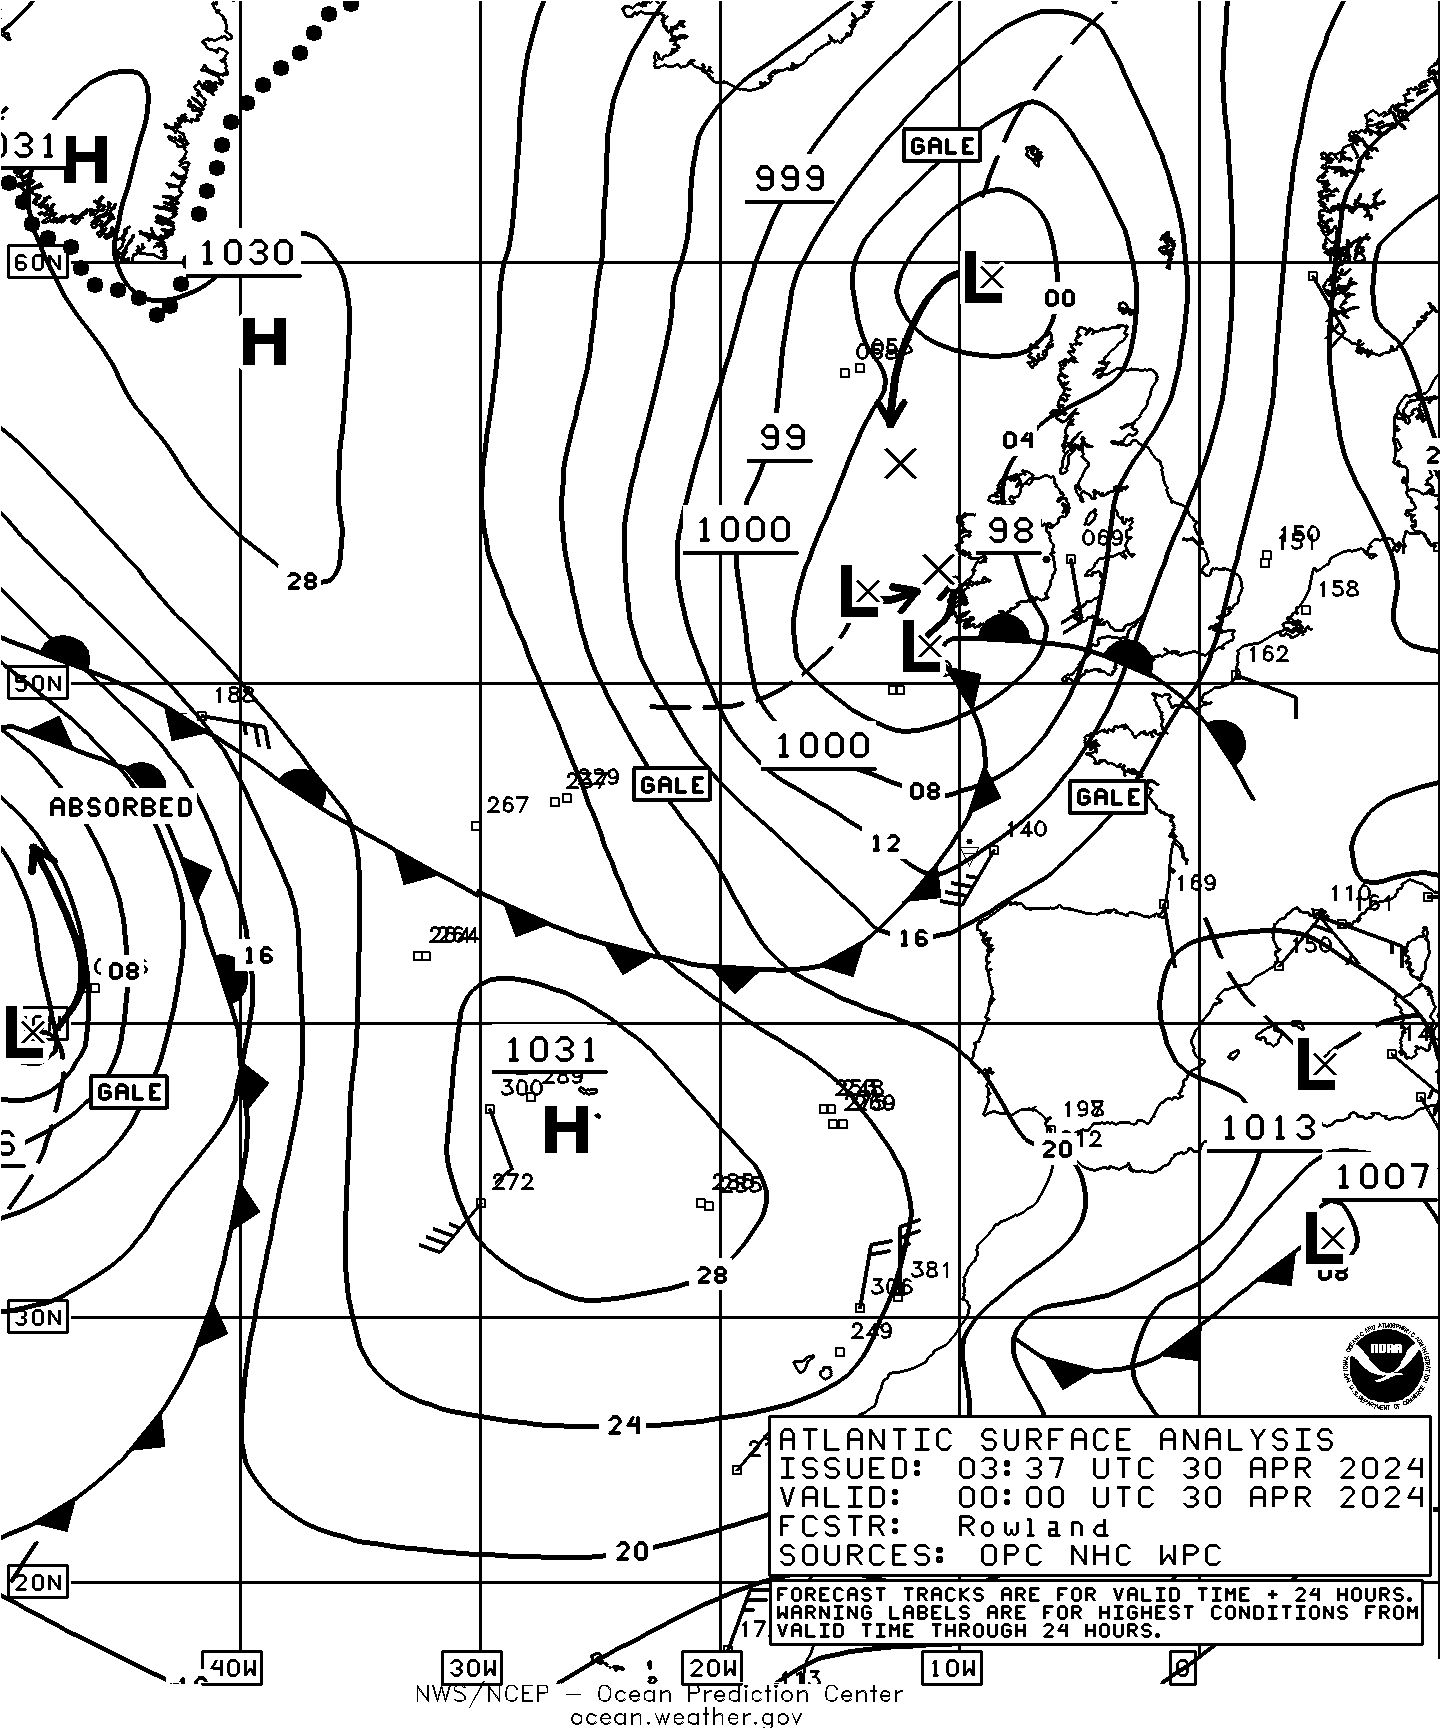
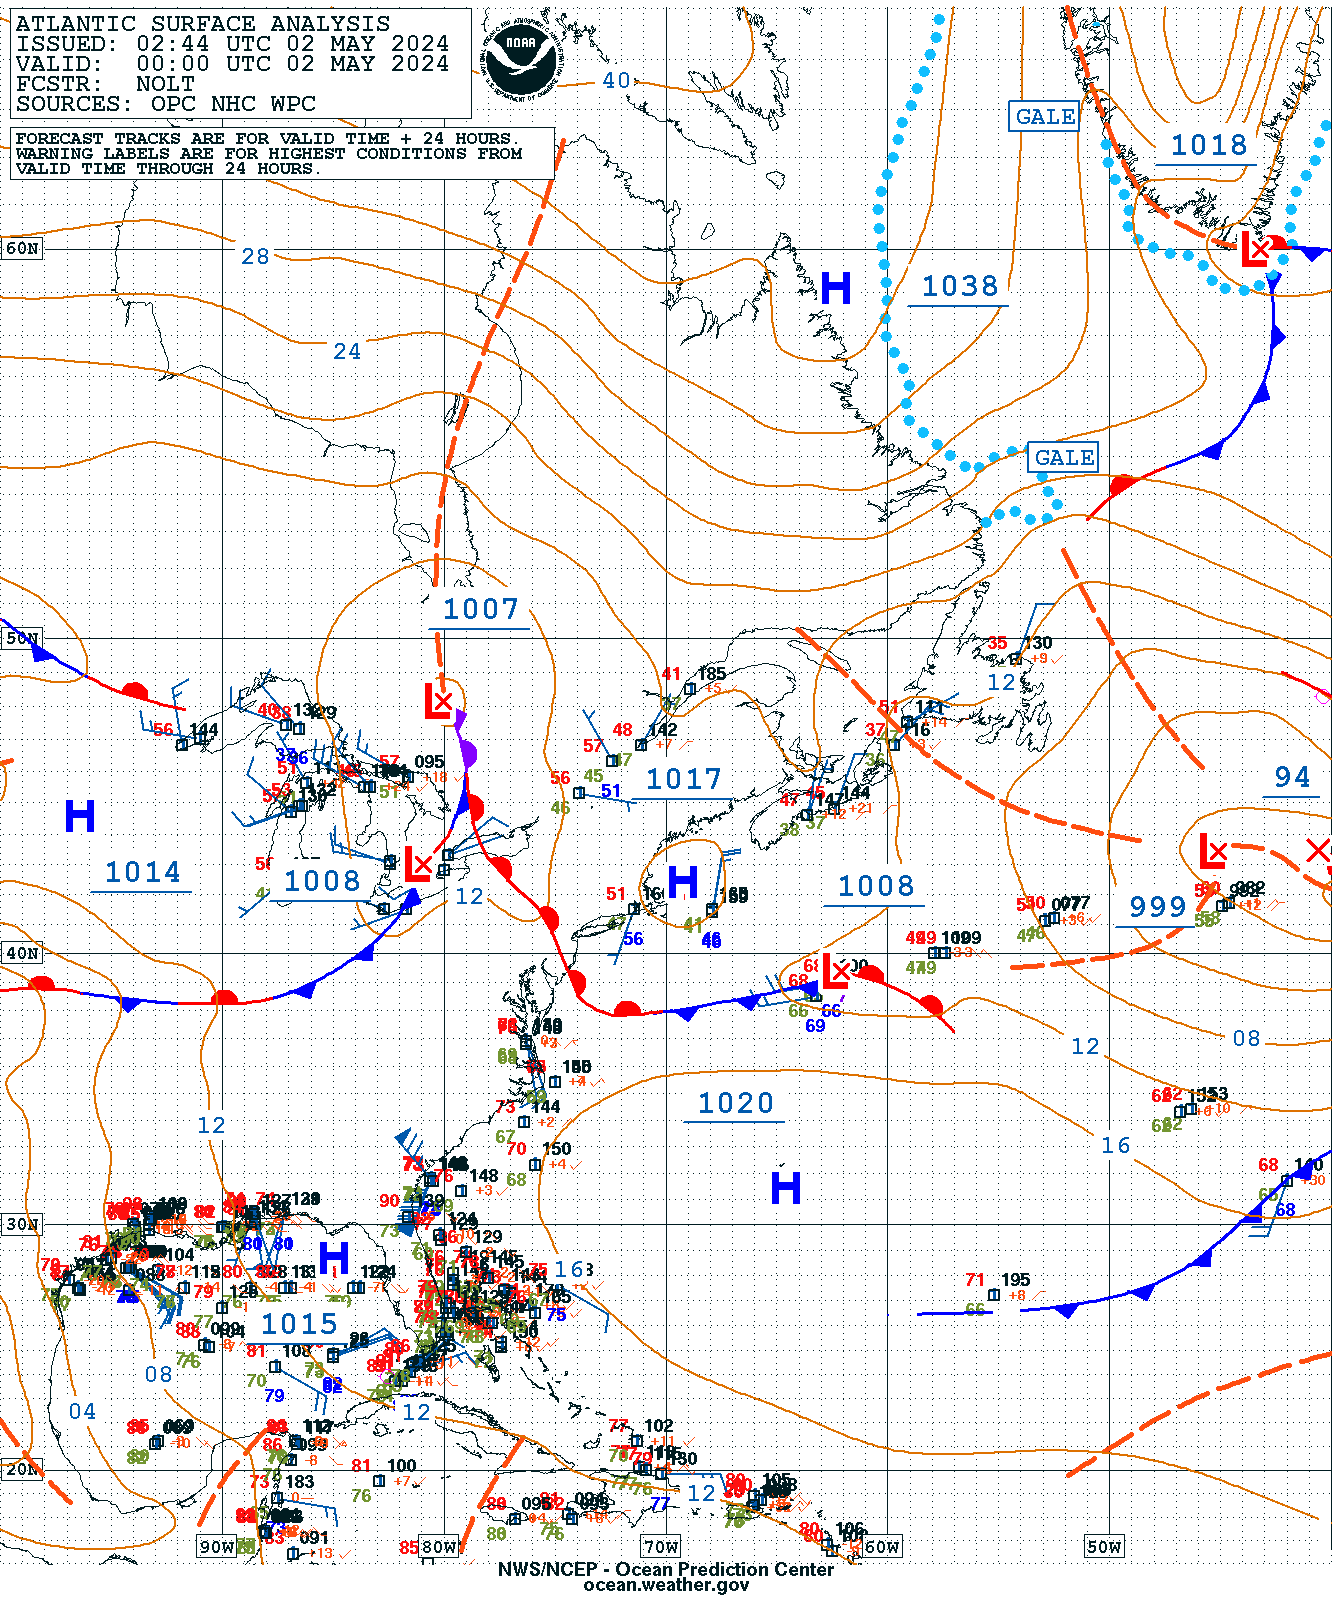
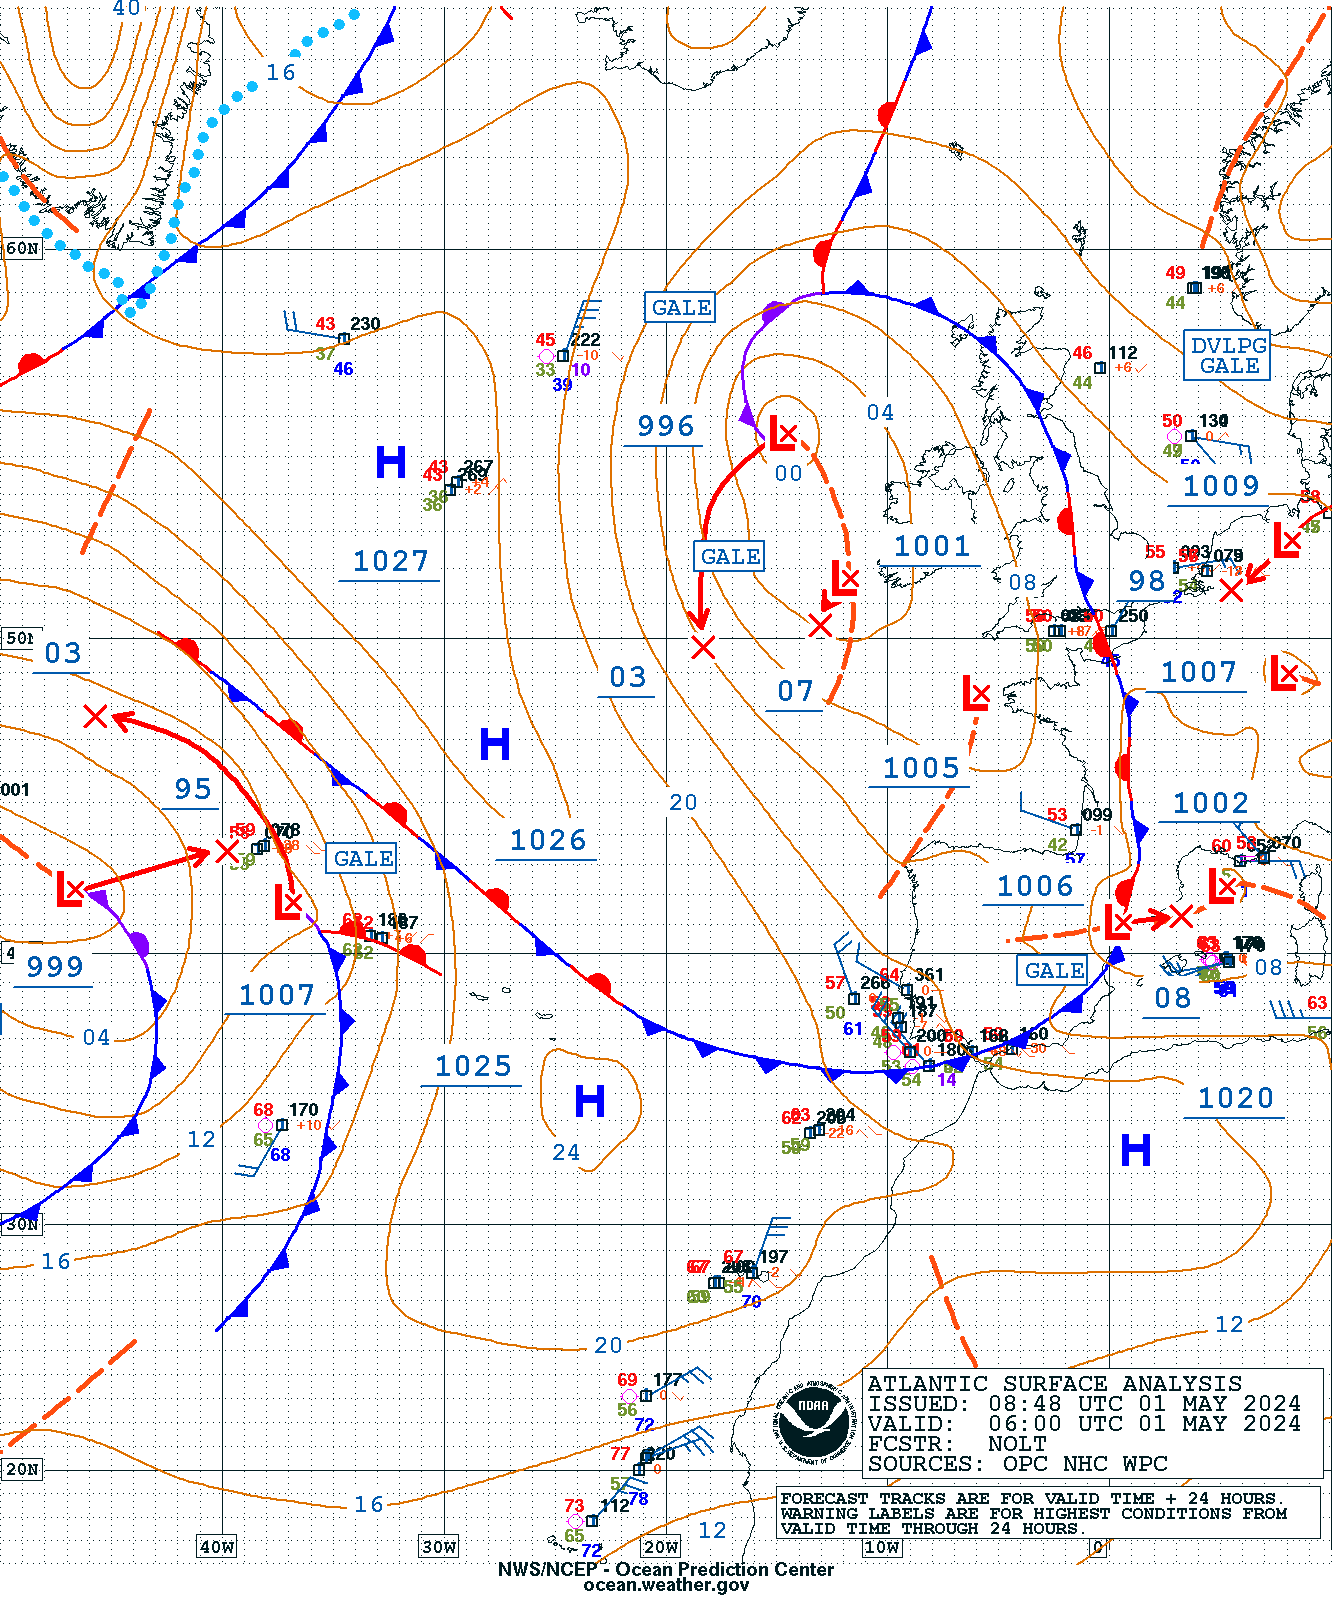
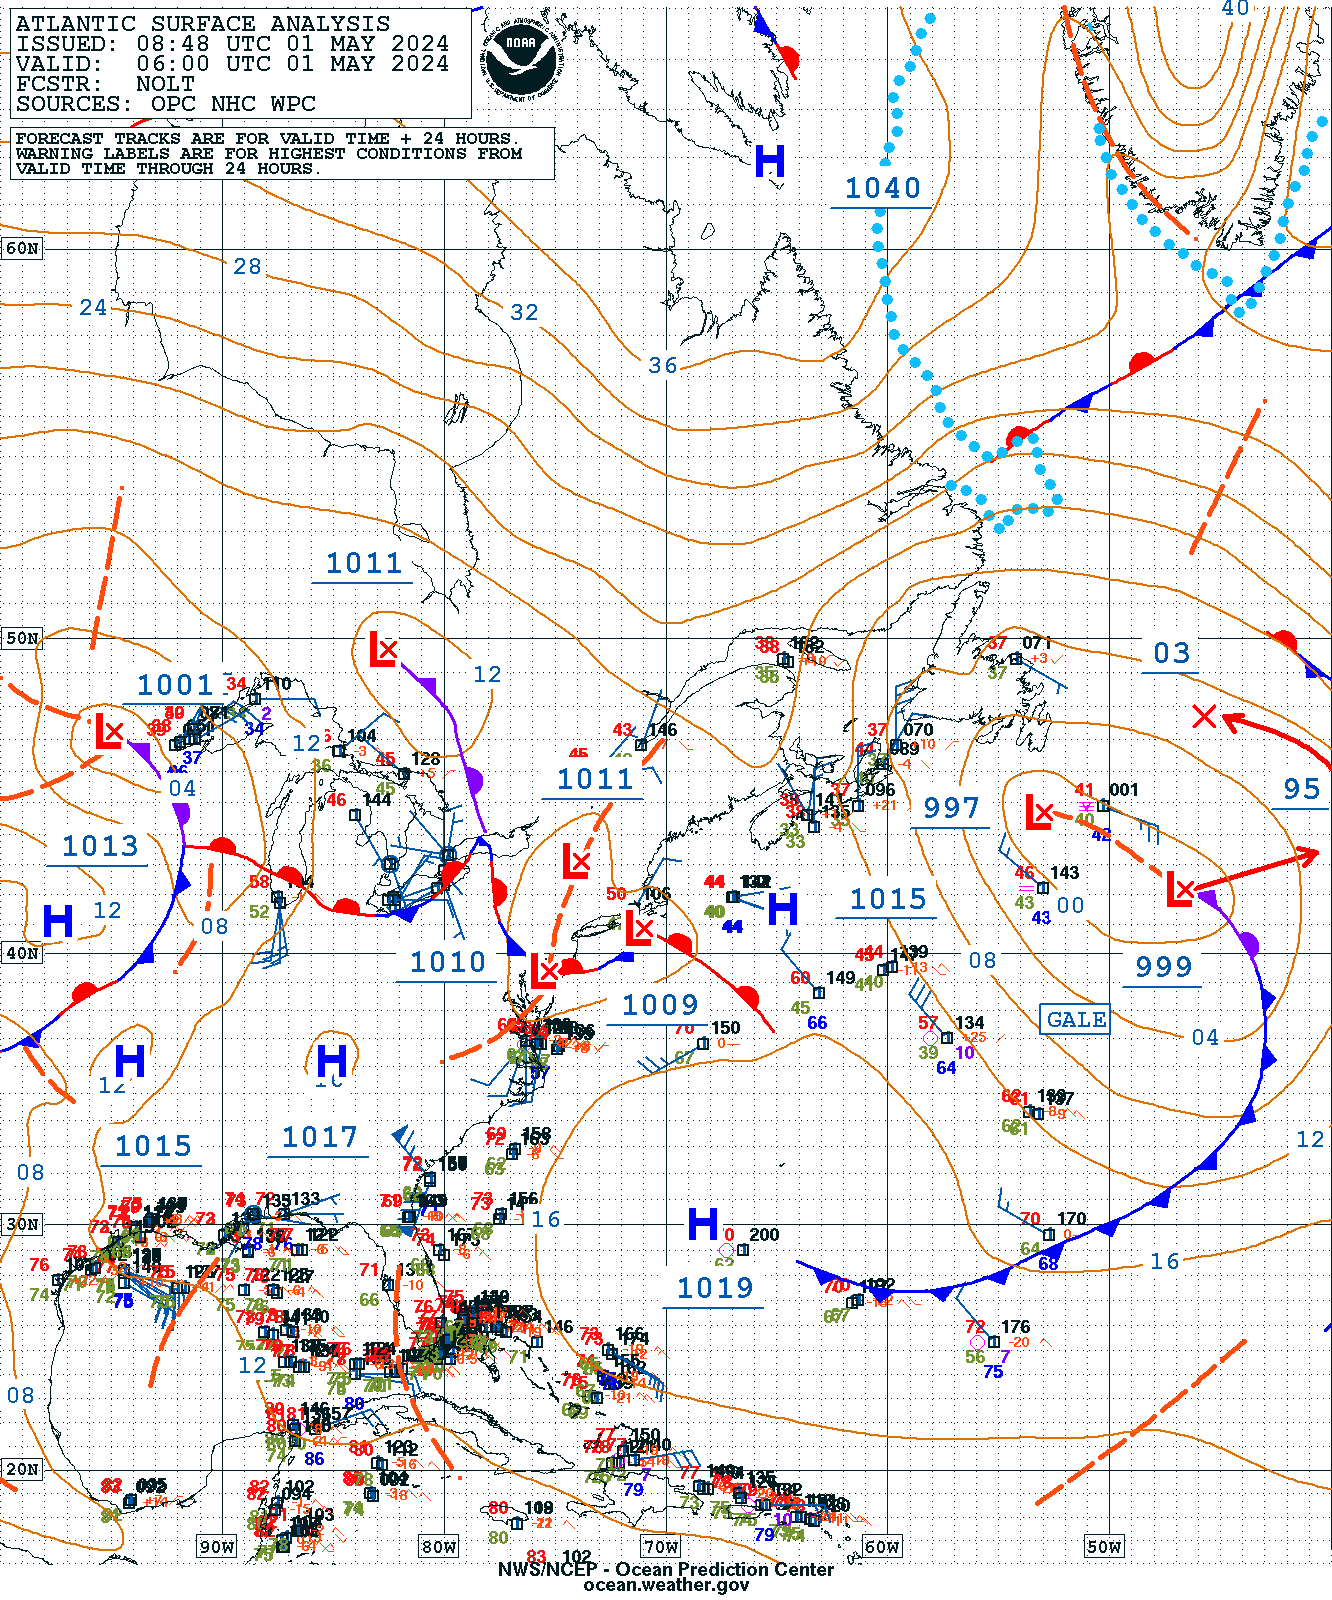
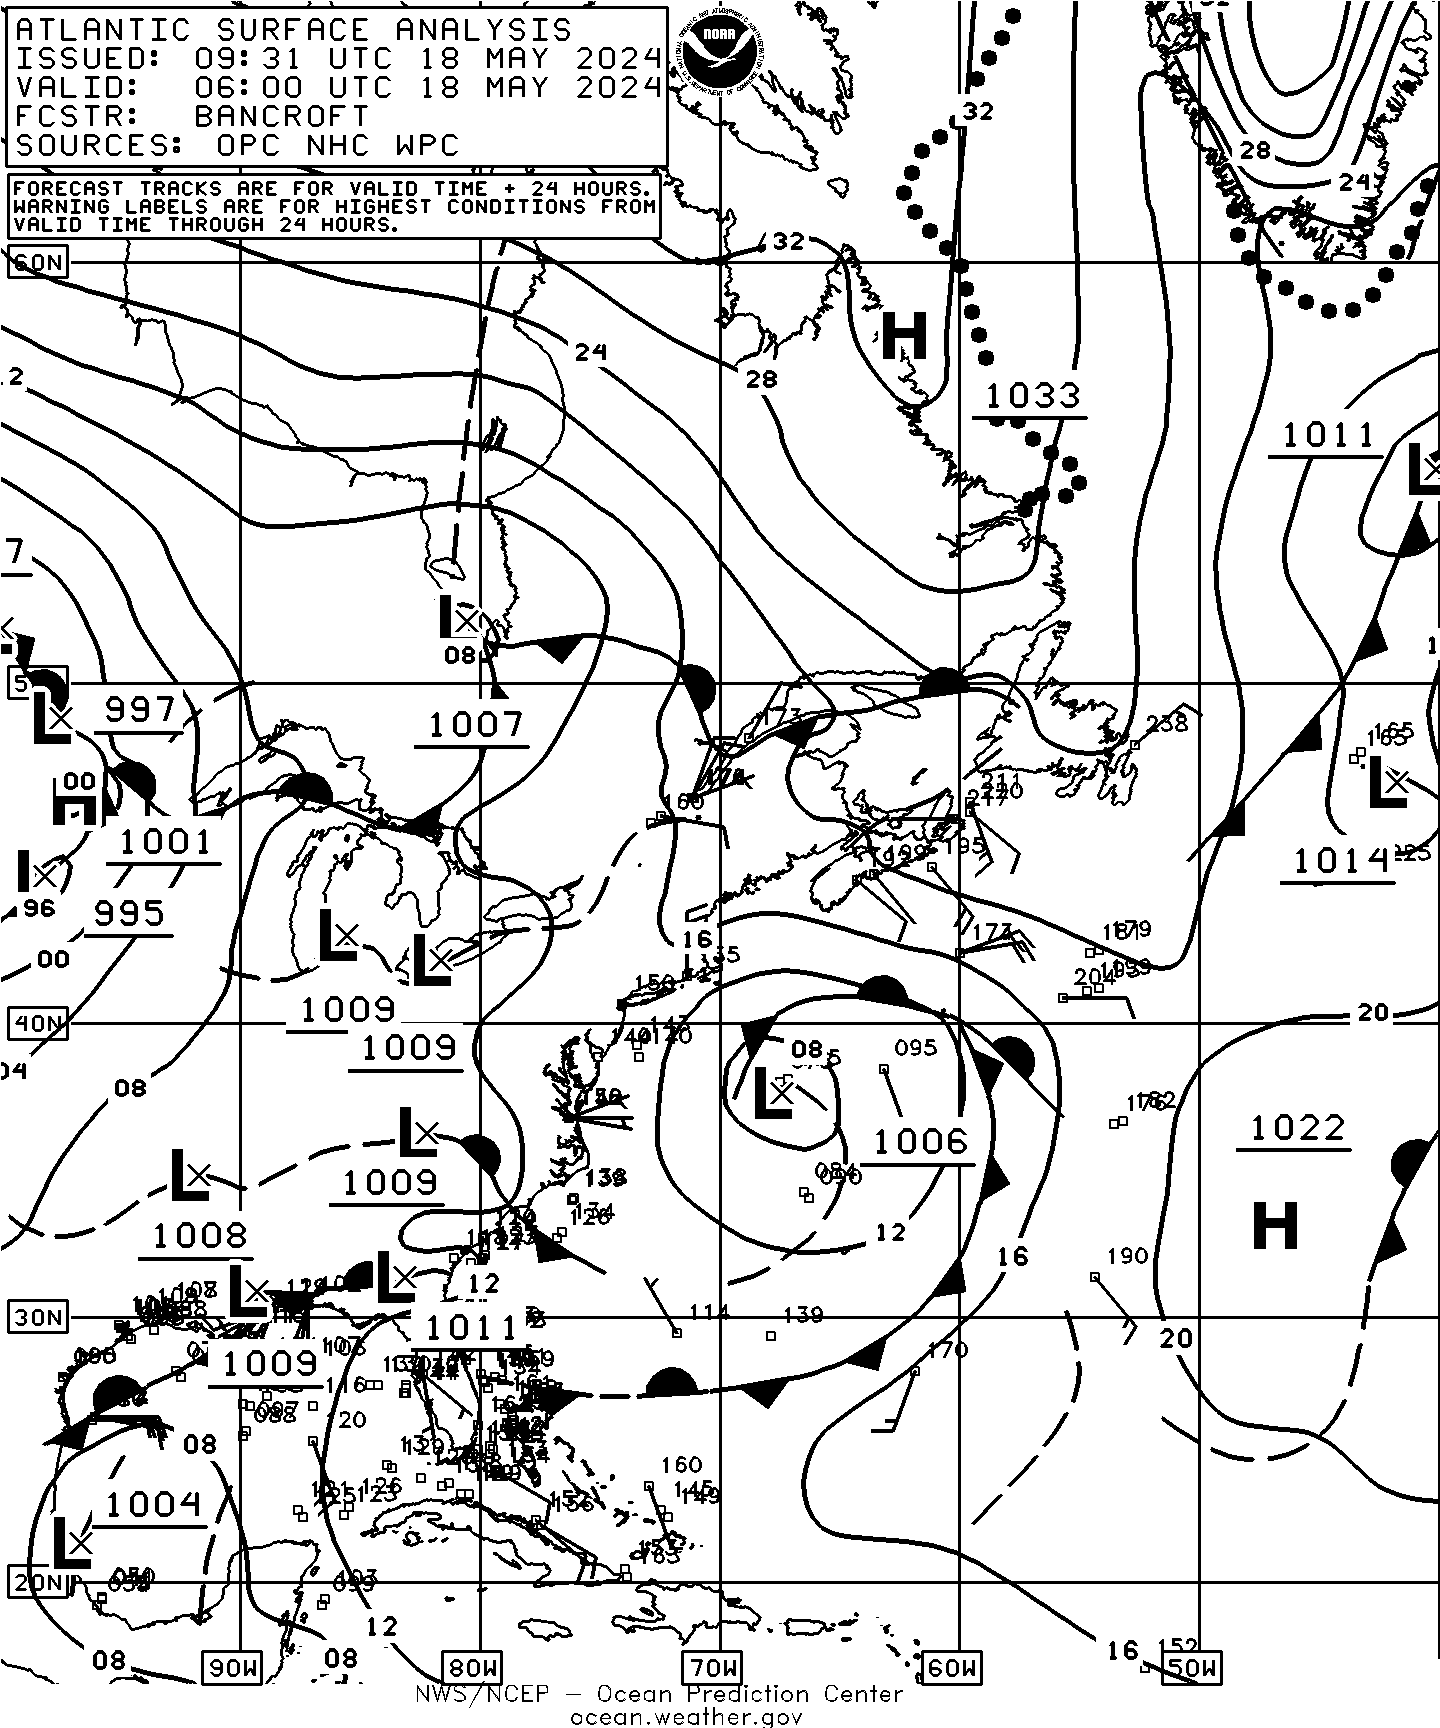
| 0325Z | 00Z Surface Analysis Part 1 (15N-65N, 10E-45W) | PYAA01 | TIF|GIF|B/W GIF | 03:11Z Jul 20 2026 |
| 0338Z | 00Z Surface Analysis Part 2 (15N-65N, 40W-95W) | PYAA02 | TIF|GIF|B/W GIF | 03:11Z Jul 20 2026 |
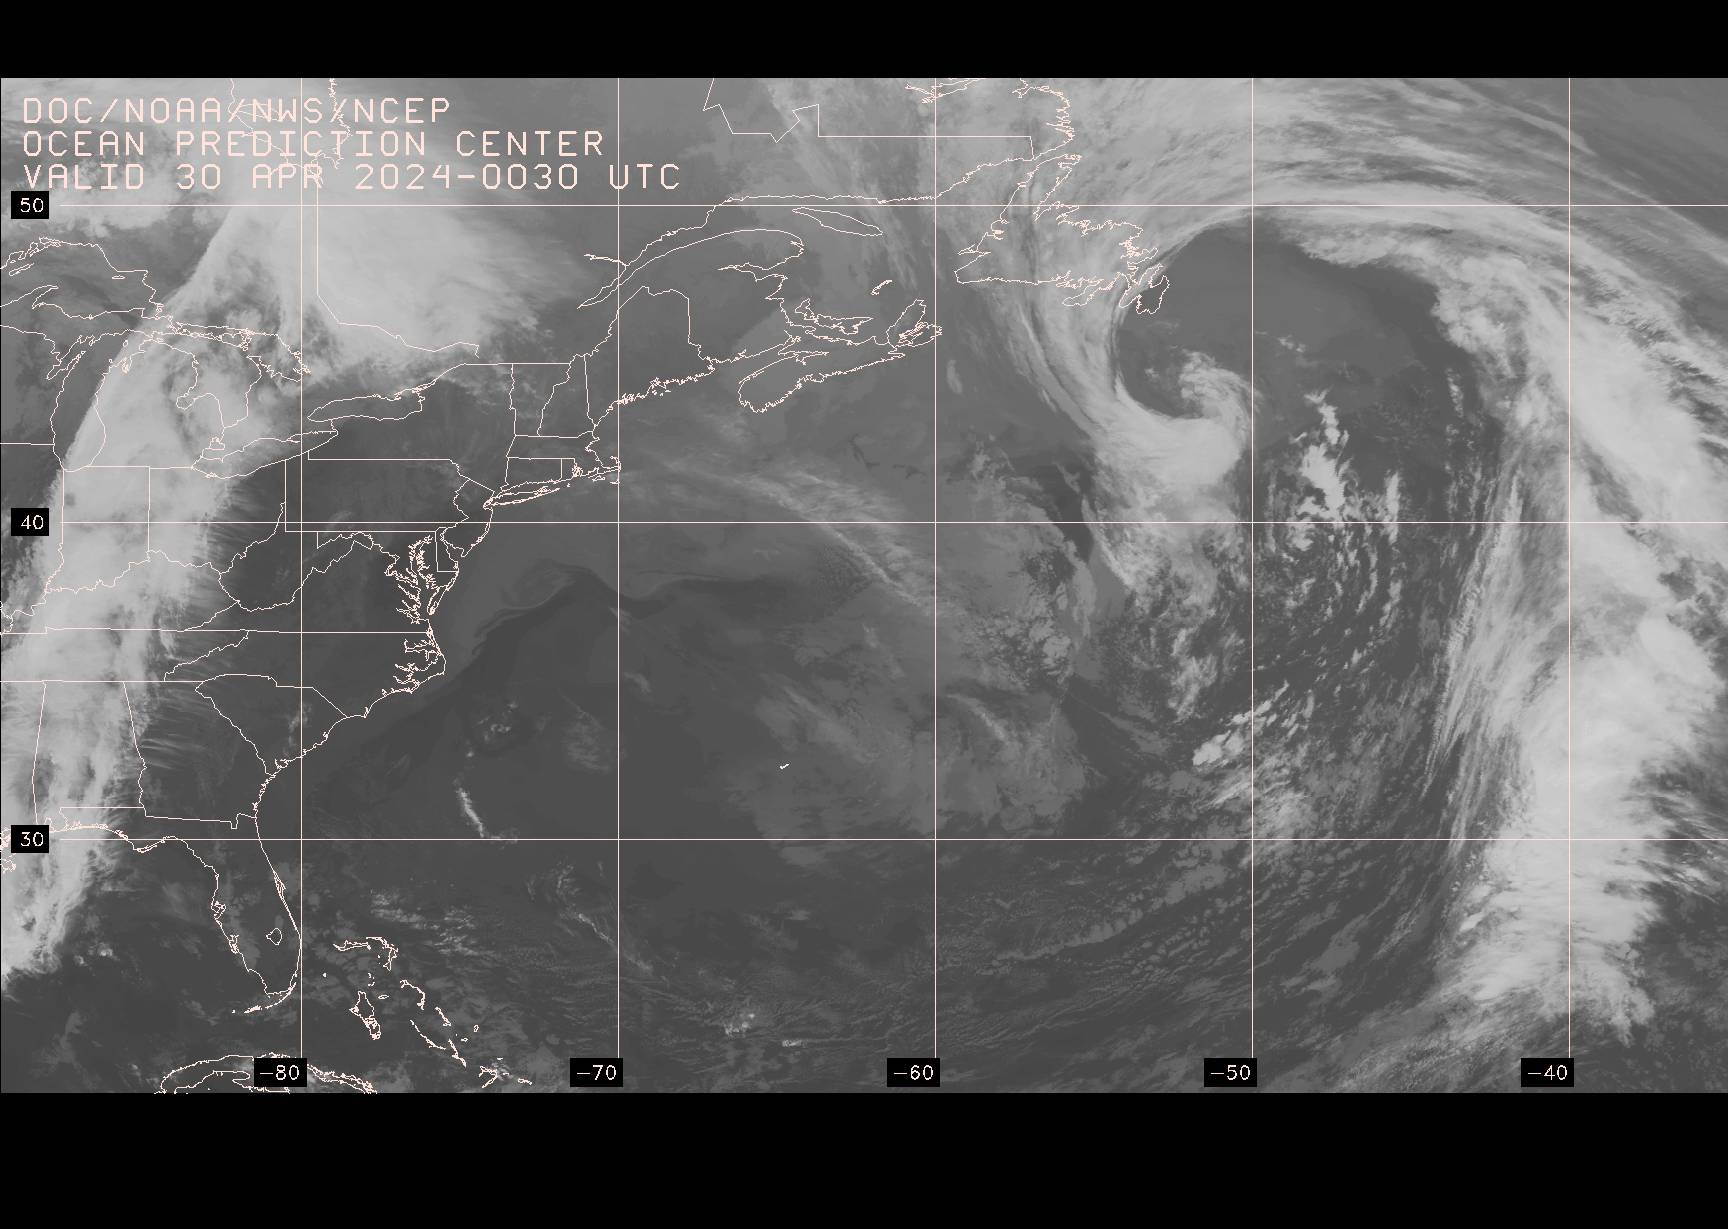
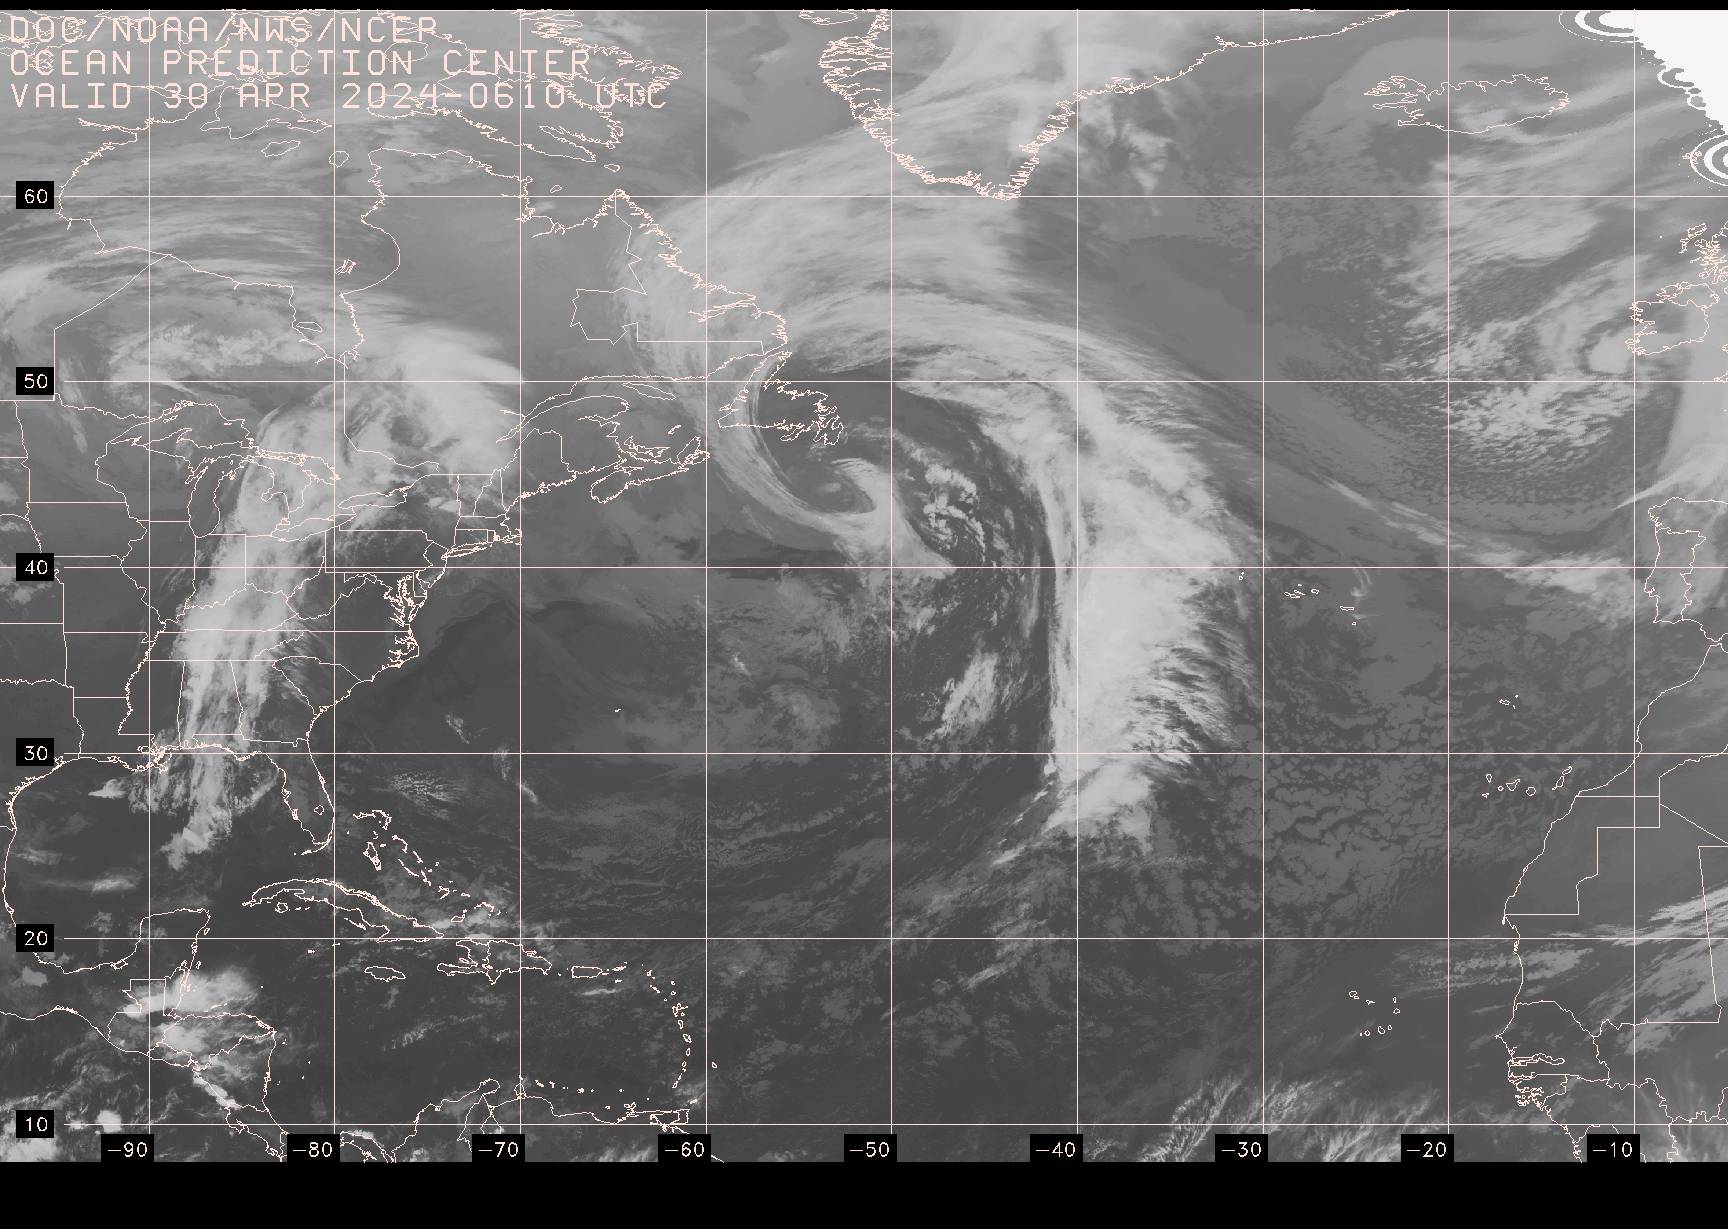
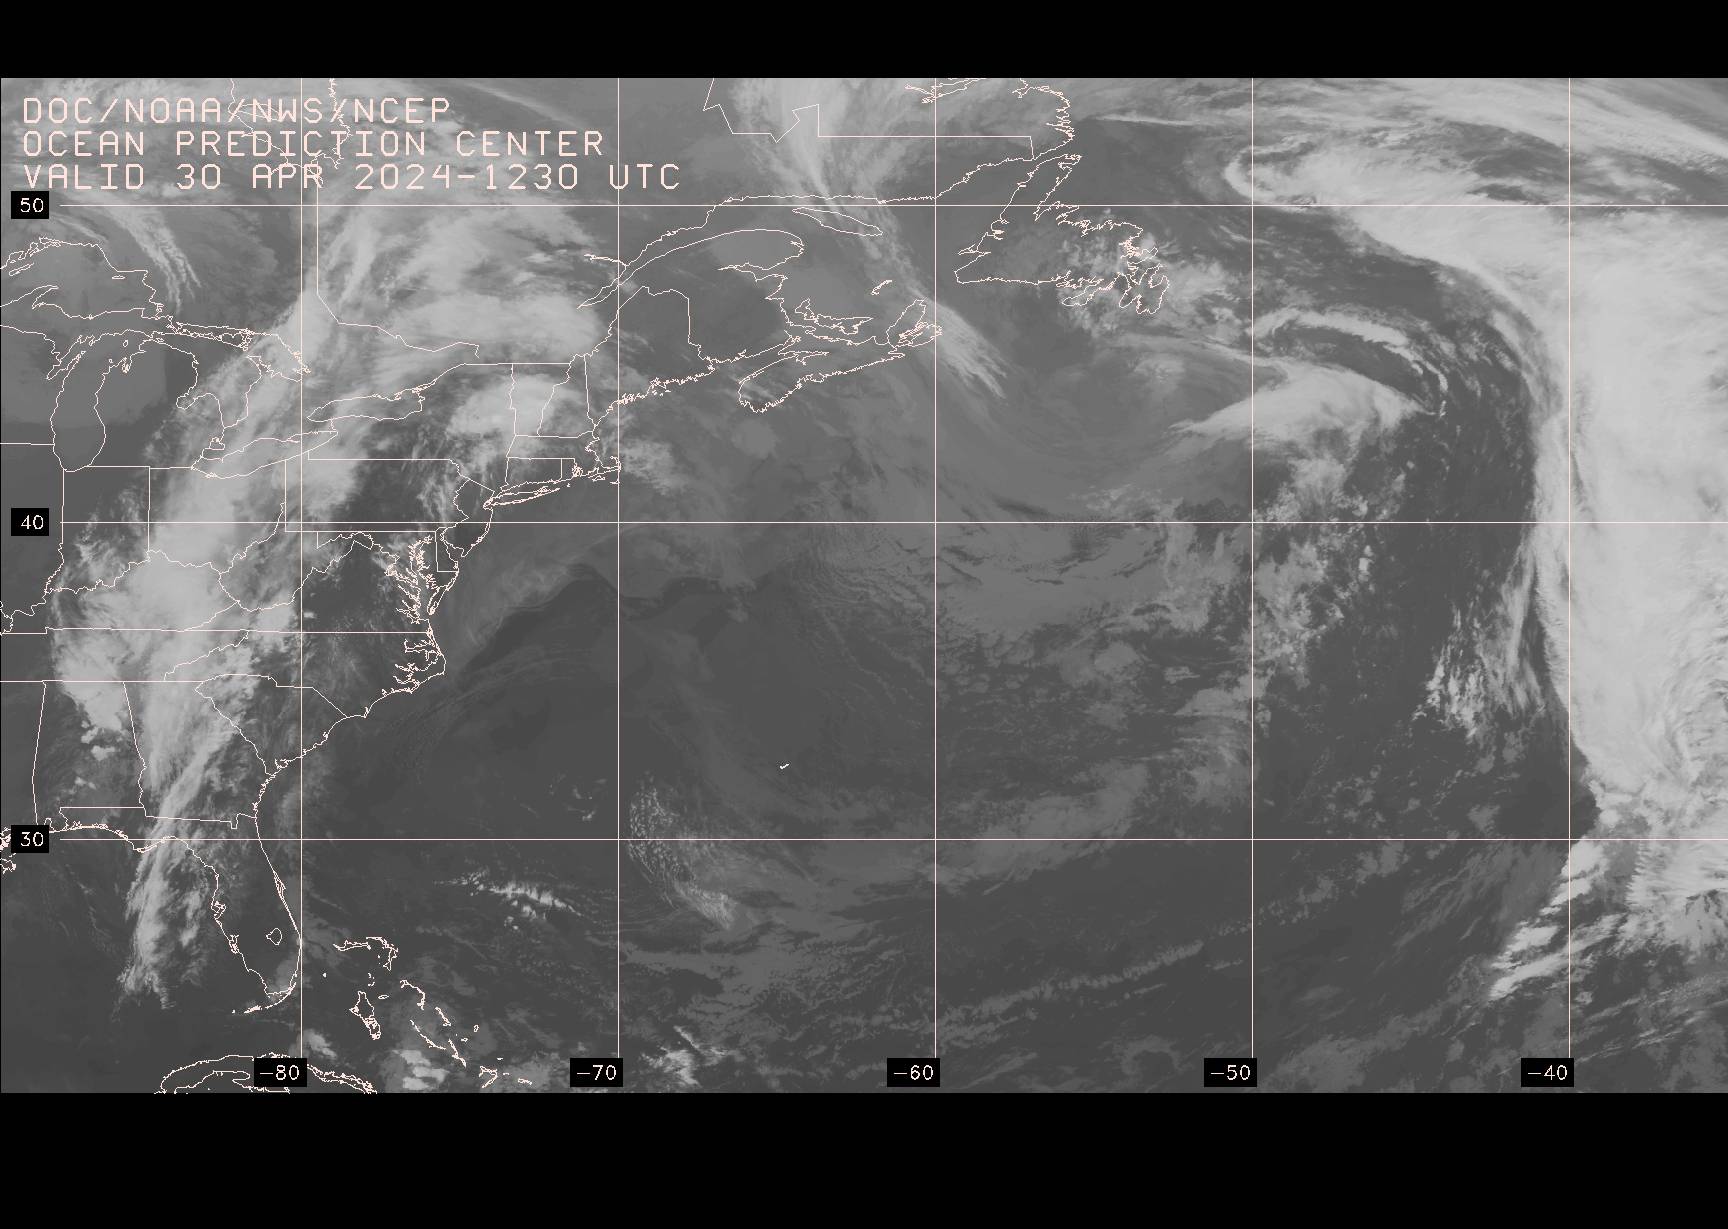
| 0351Z | Satellite Picture (20N-55N, 55W-95W) | EVNT00 | JPG | |
| 0402Z | Retransmit 0325Z: 00Z Surface Analysis Part 1 (15N-65N, 10E-45W) | |||
| 0415Z | Retransmit 0338Z: 00Z Surface Analysis Part 2 (15N-65N, 40W-95W) | |||
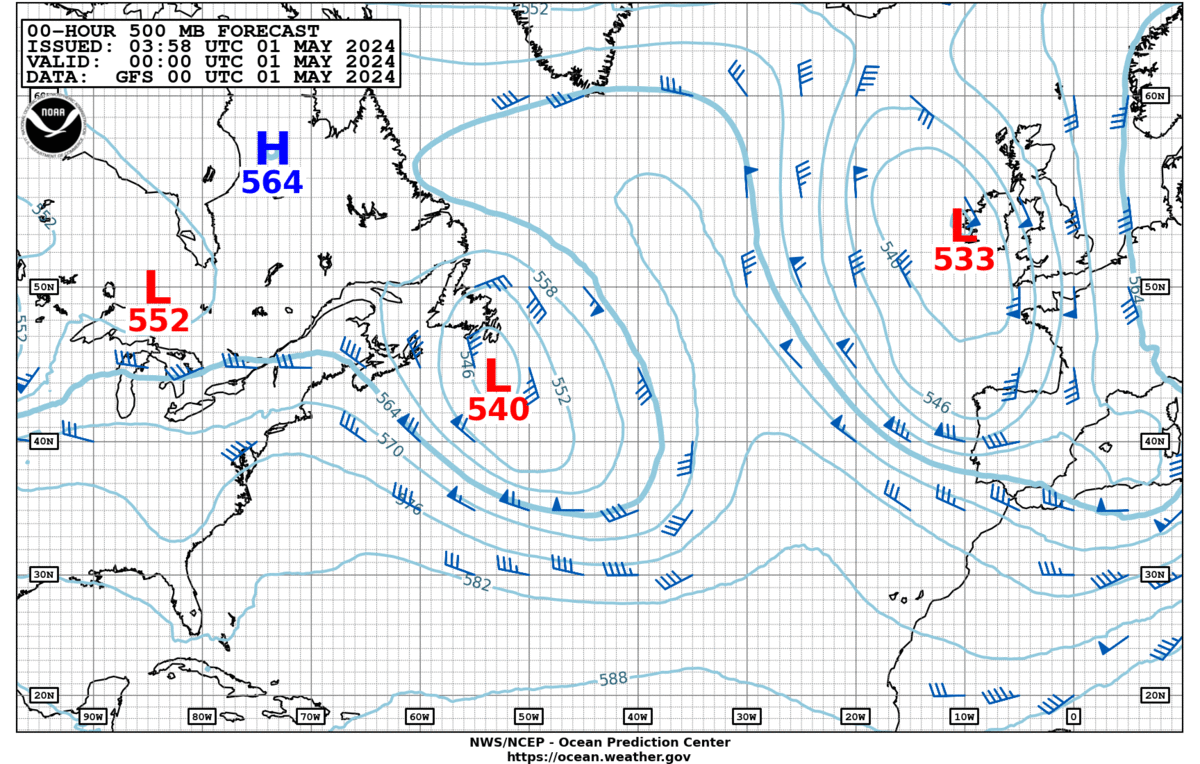
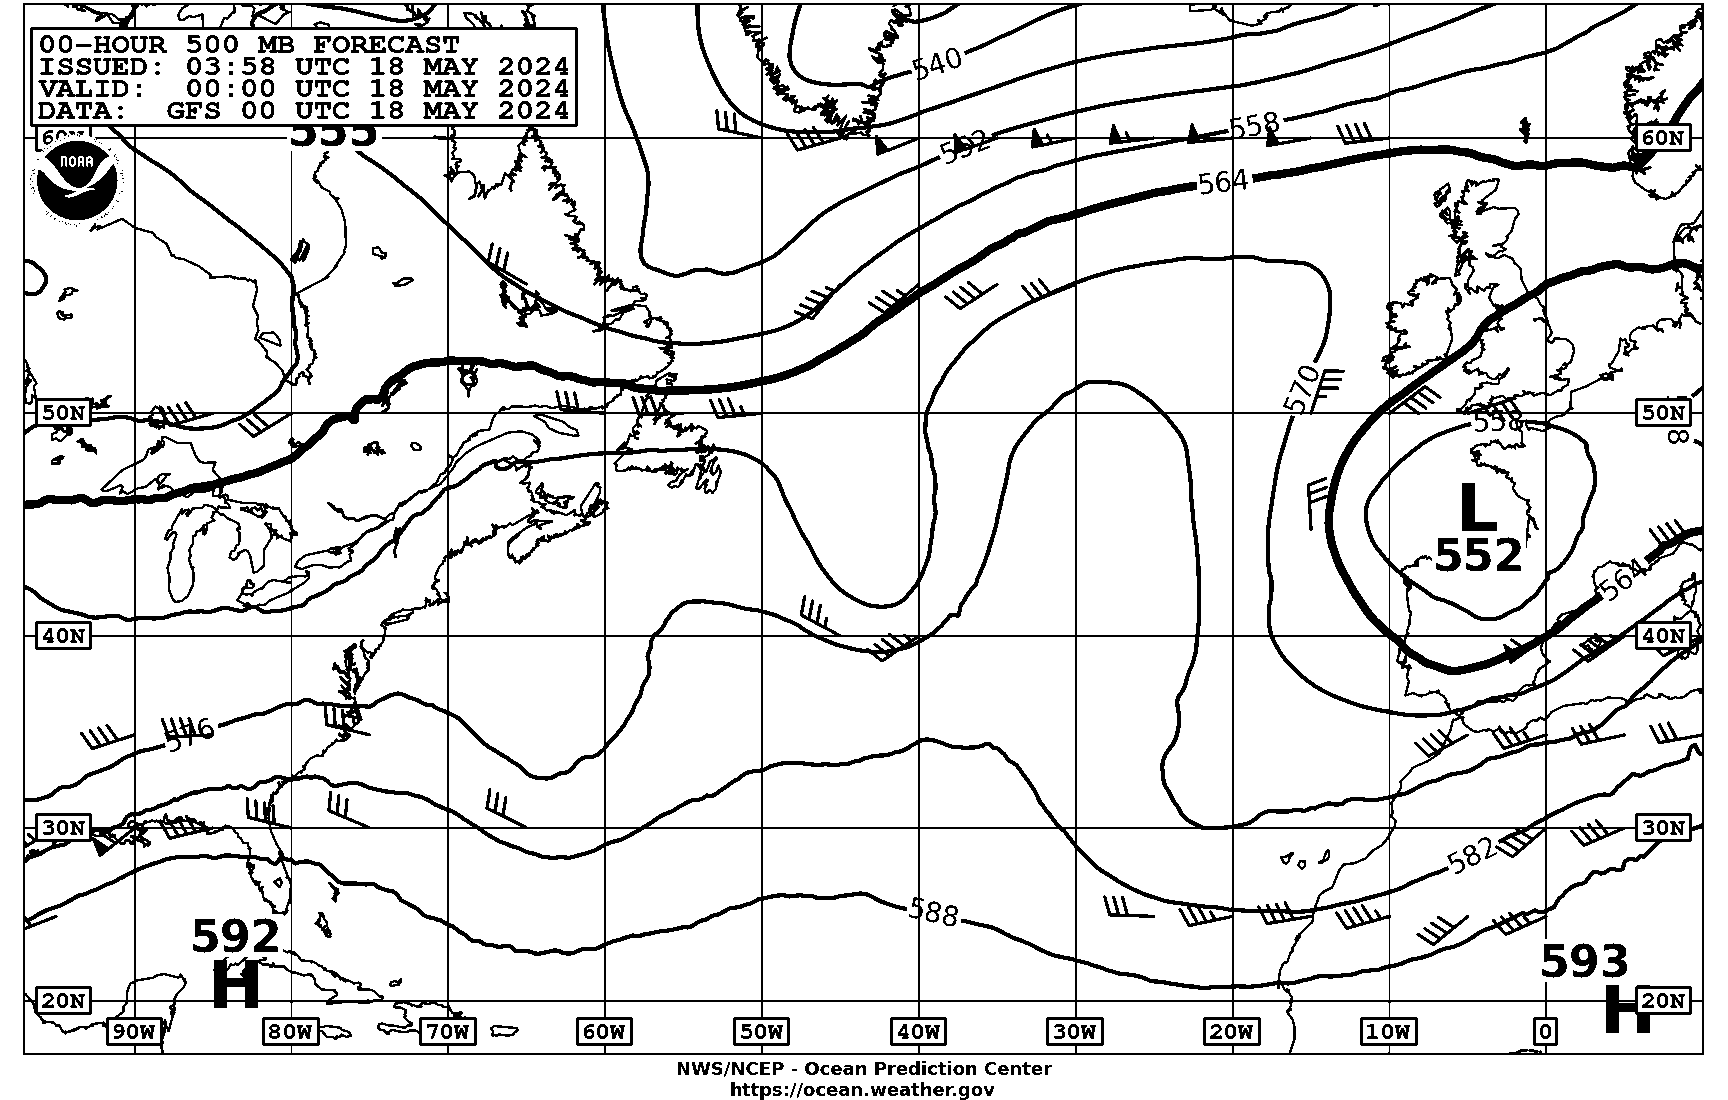
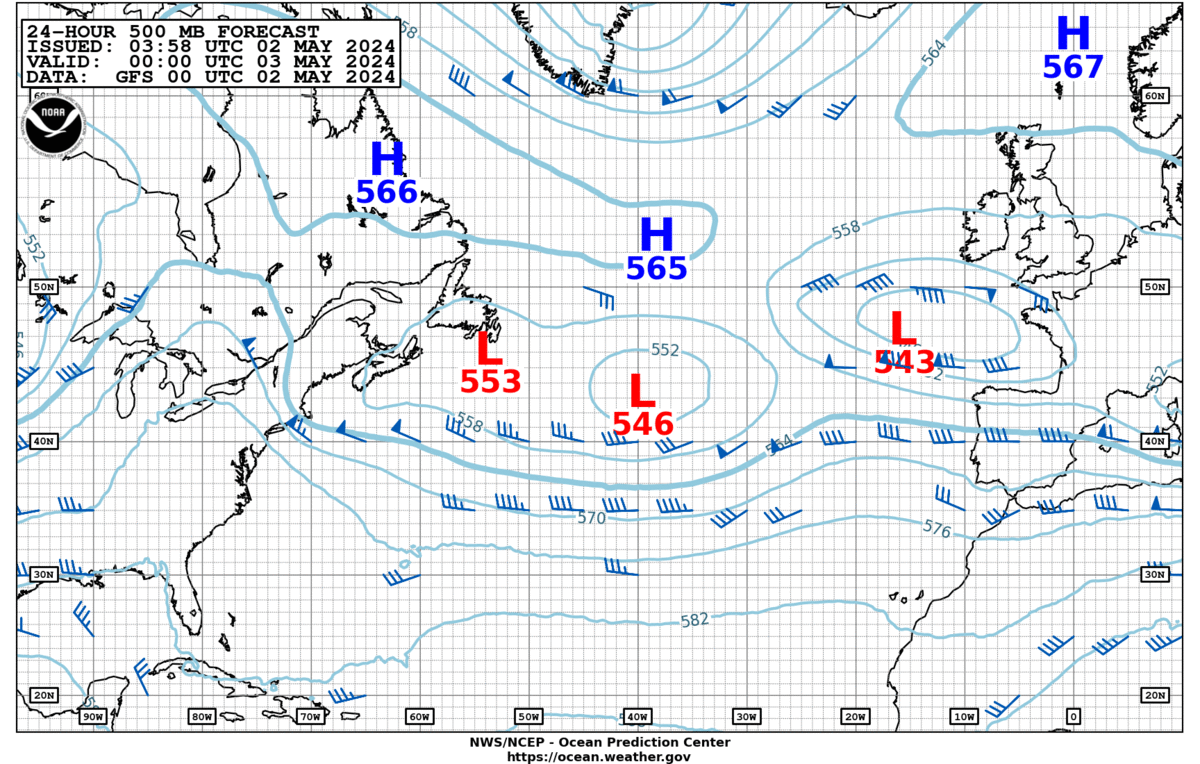
| 0428Z | 00Z 500mb Analysis (15N-65N, 10E-95W) | PPAA50 | TIF|GIF|B/W GIF | 03:58Z Jul 20 2026 |
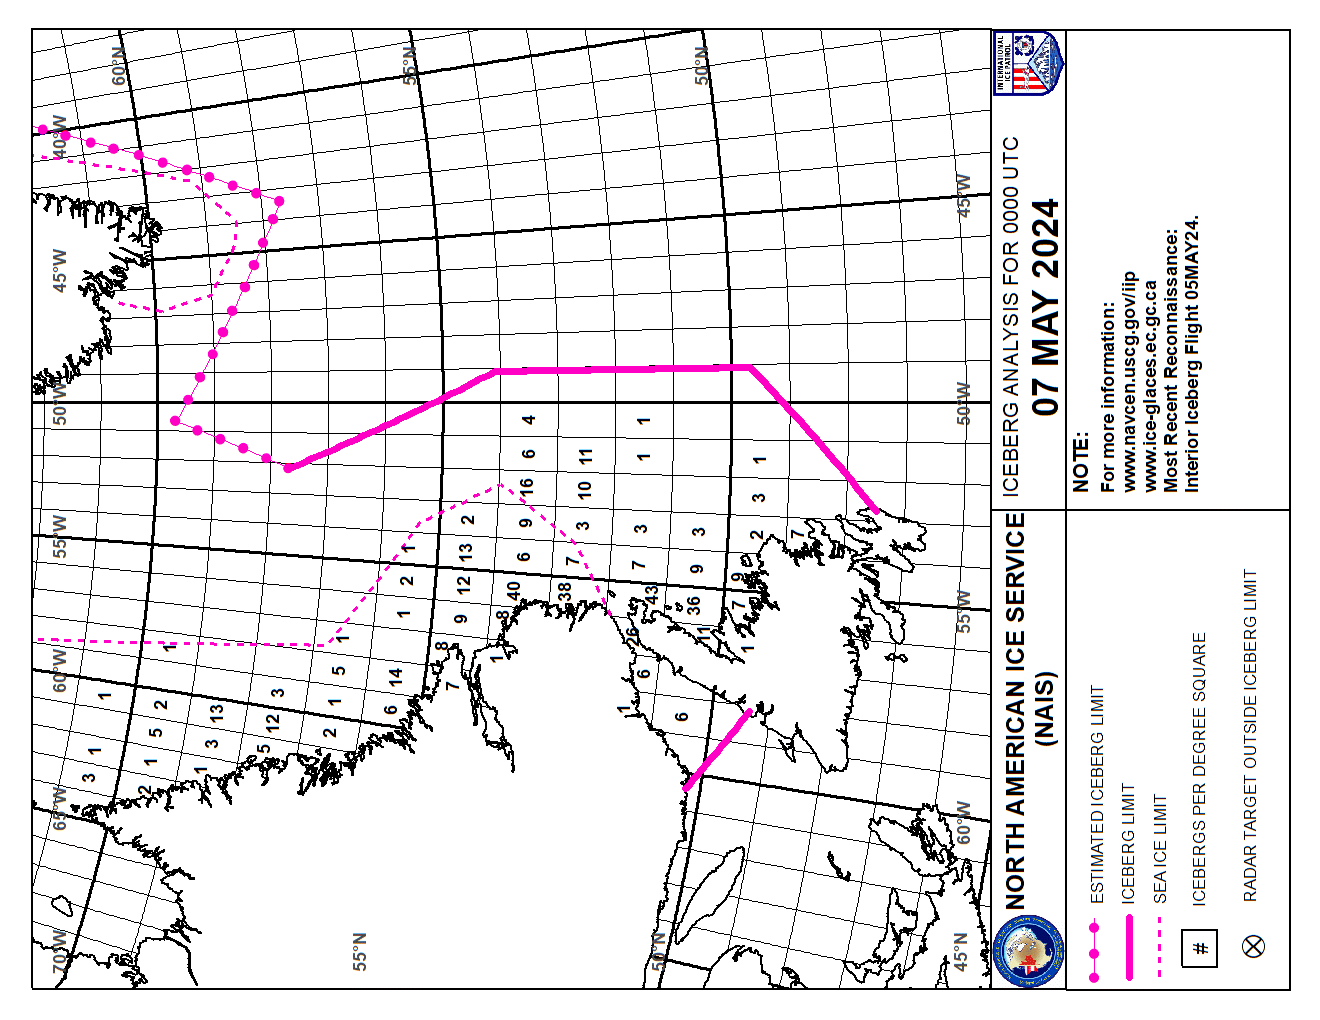
| 0438Z | North American Ice Service Chart | PIEA88 | TIF|GIF | |
| 0452Z | Cyclone Danger Area (*see note above) or High Wind&Wave**(5N-40N, 35W-100W) | PWEK89 | TIF|GIF | |
| 0745Z | Test Pattern | PZZZ94 | ||
| 0755Z | 06Z Preliminary Surface Analysis (28N-52N, 45W-85W) | PYAB01 | TIF|GIF | |
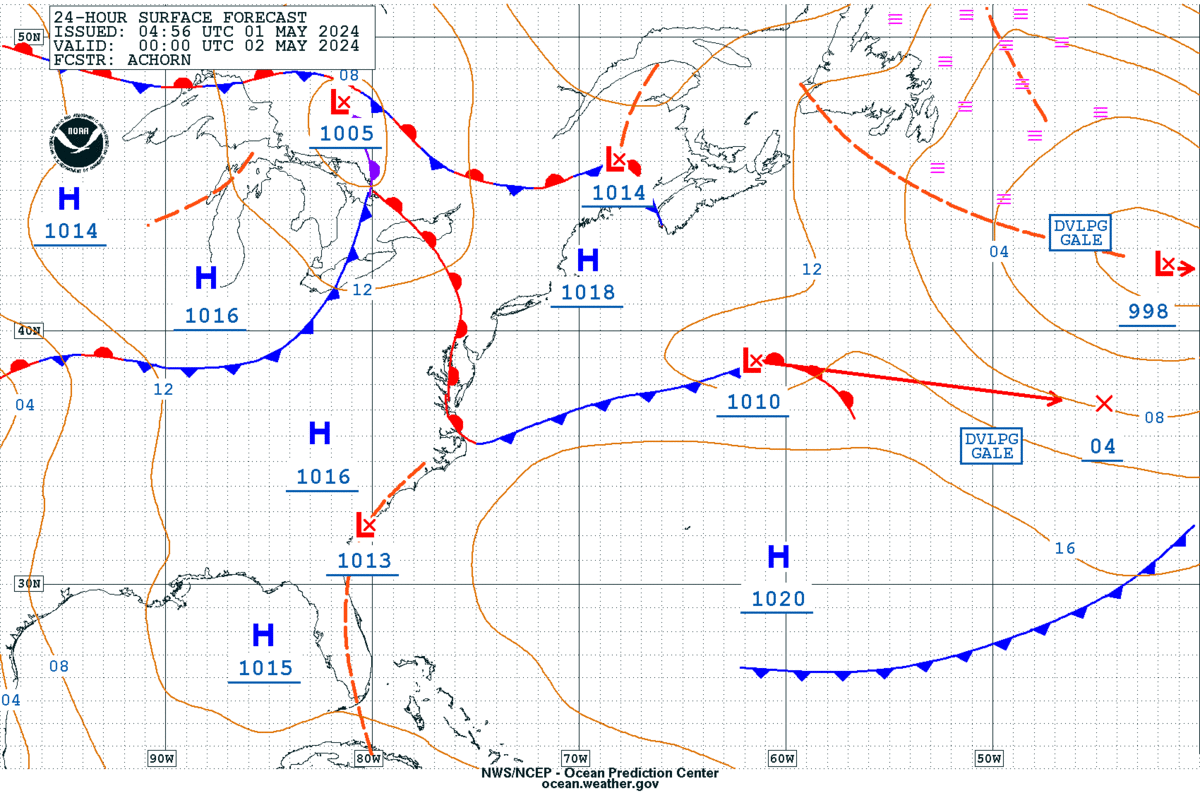
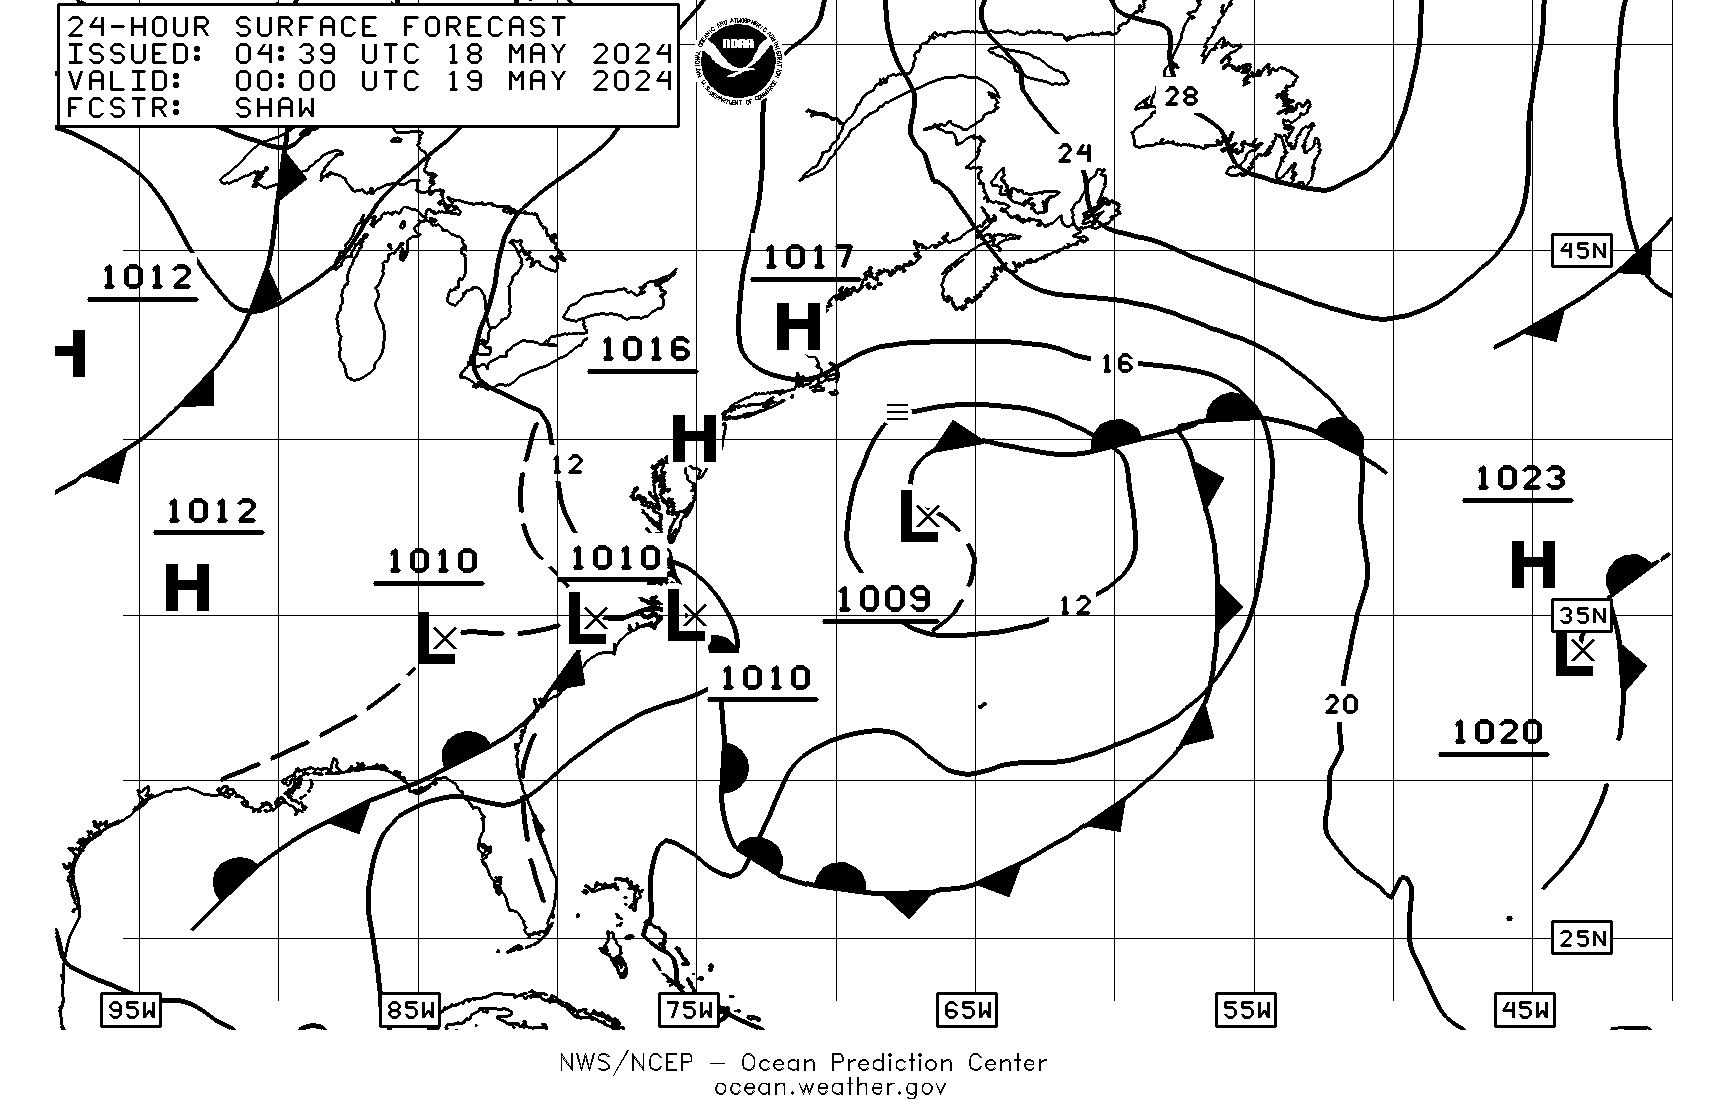
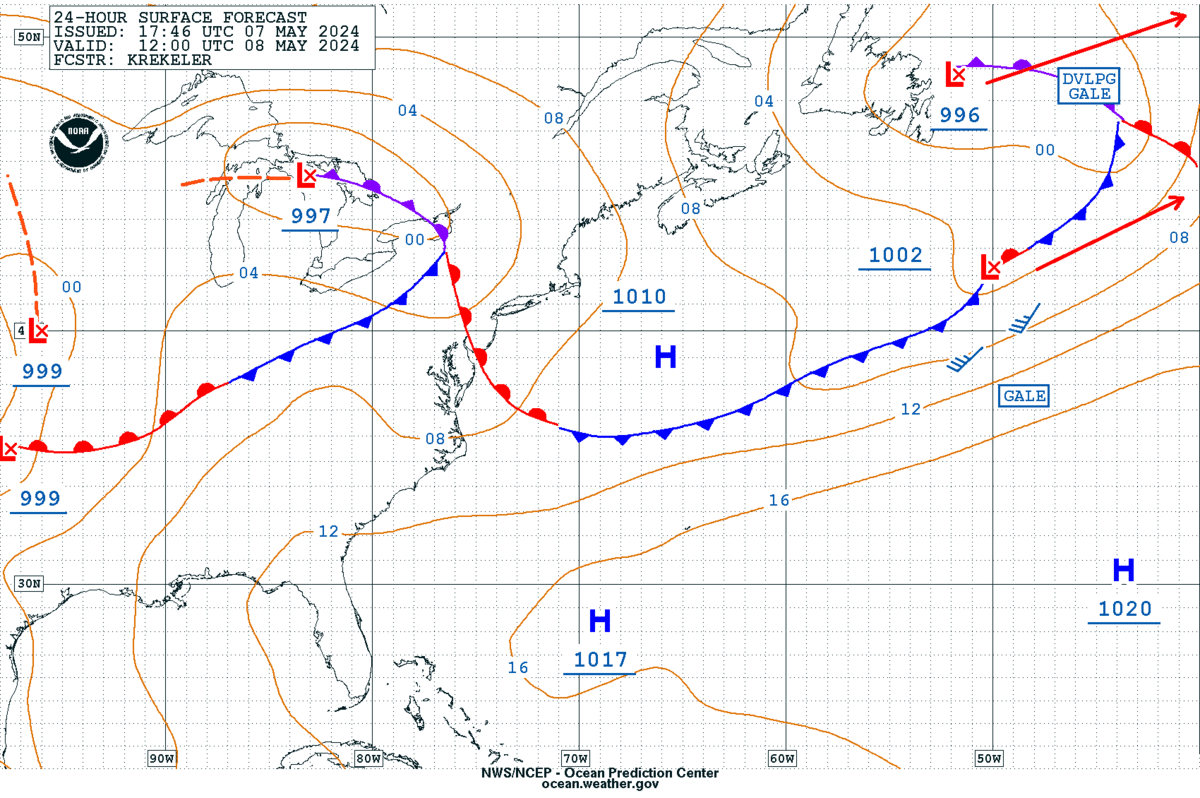
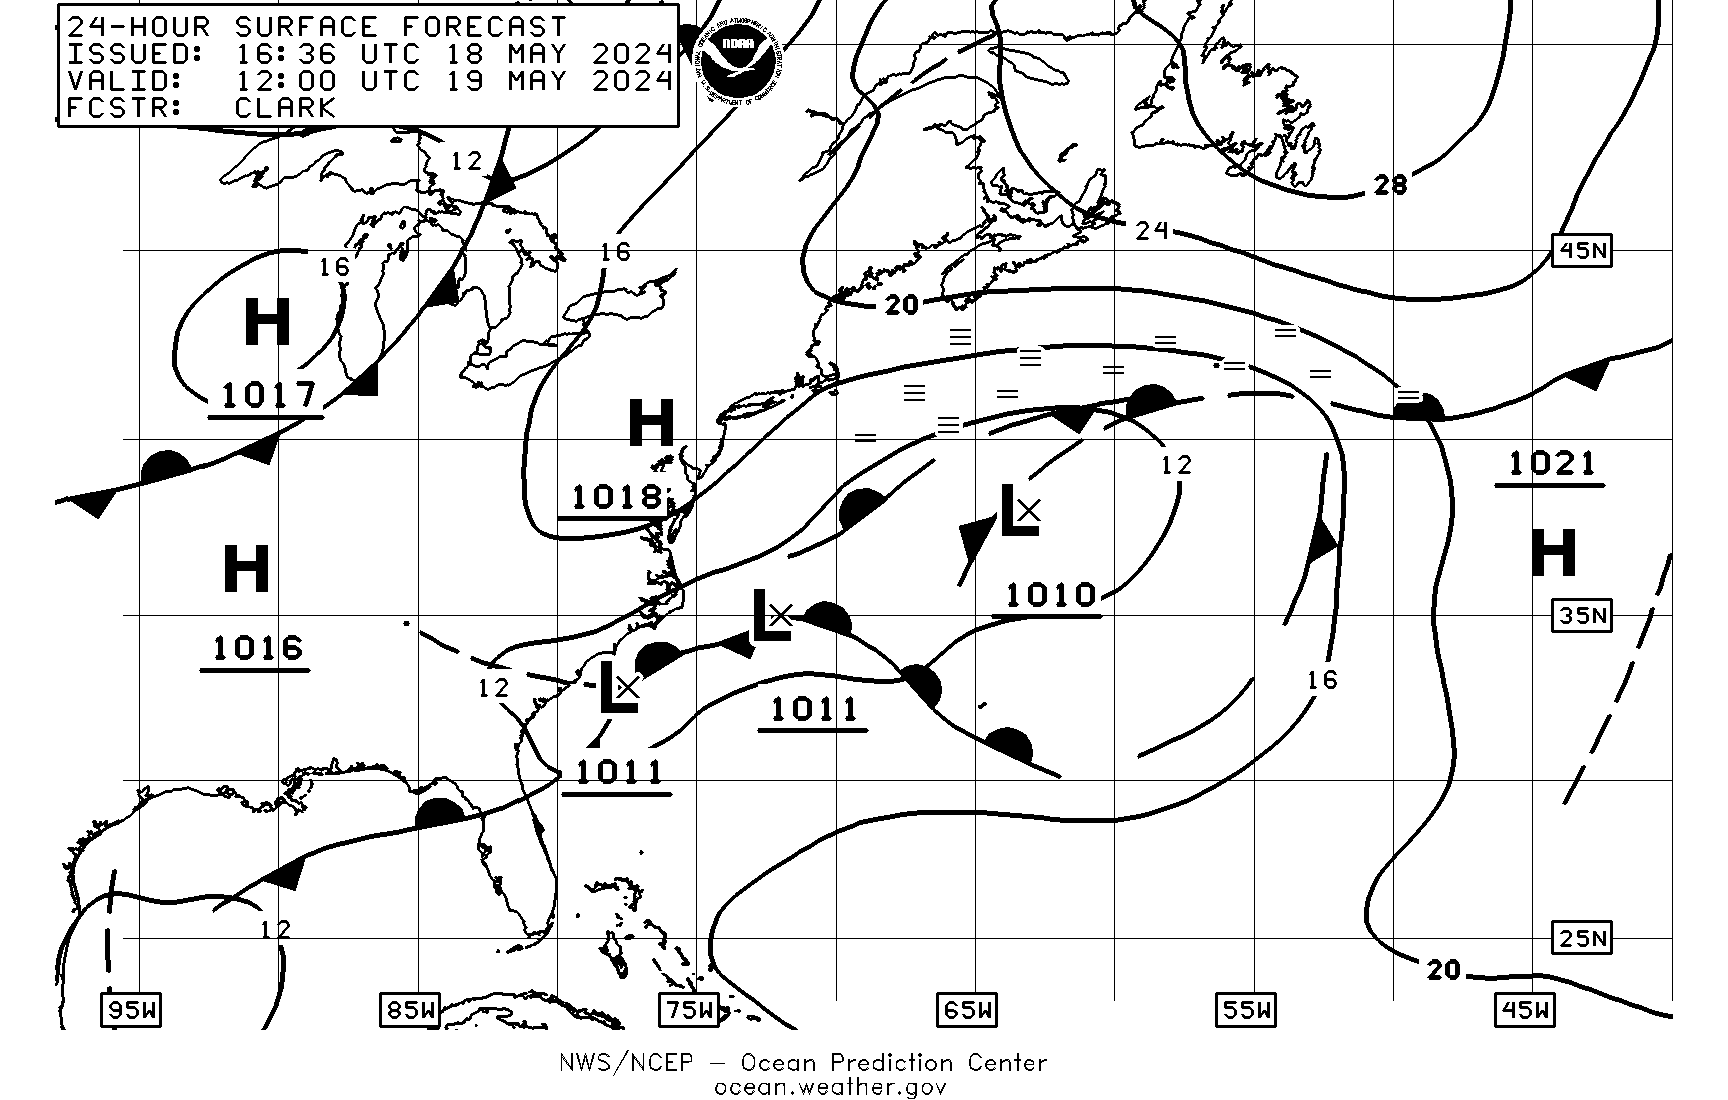
| 0805Z | 24Hr Surface/Ice Accretion VT 00Z (15N-65N, 10E-95W) | PPAE00 | TIF|GIF|B/W GIF | 04:54Z Jul 20 2026 |
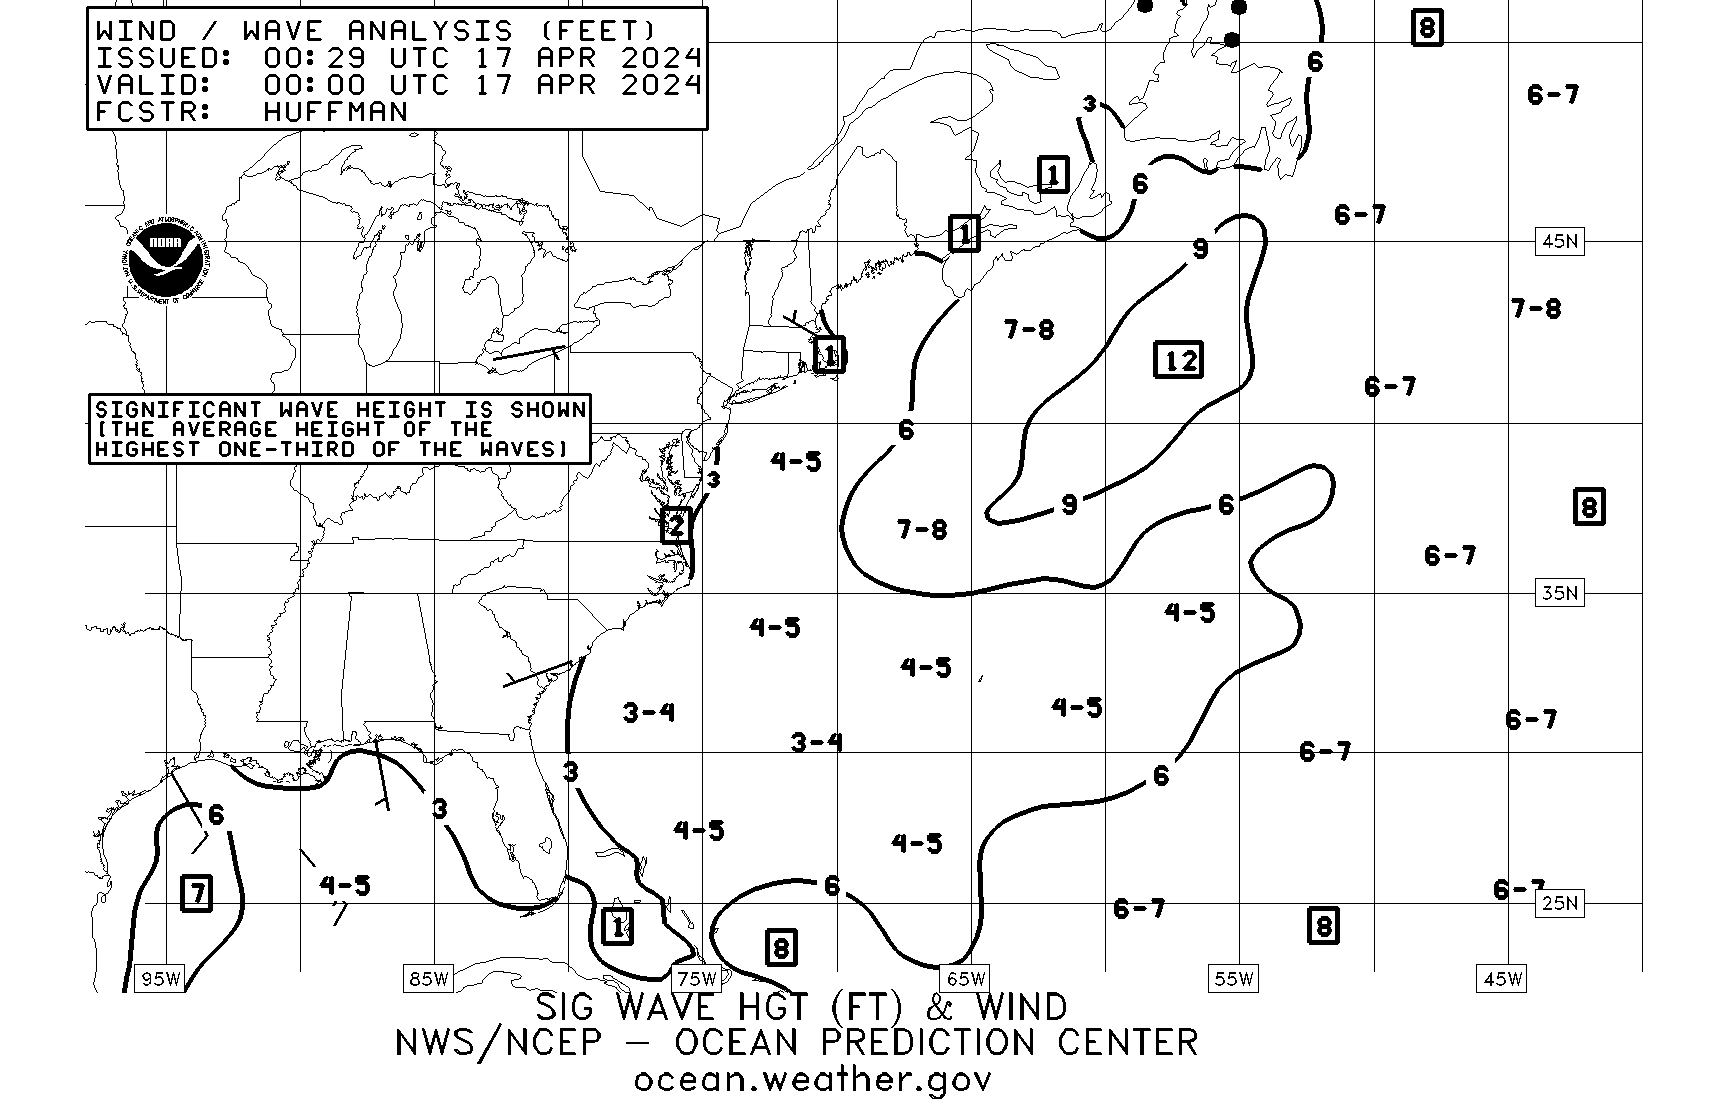
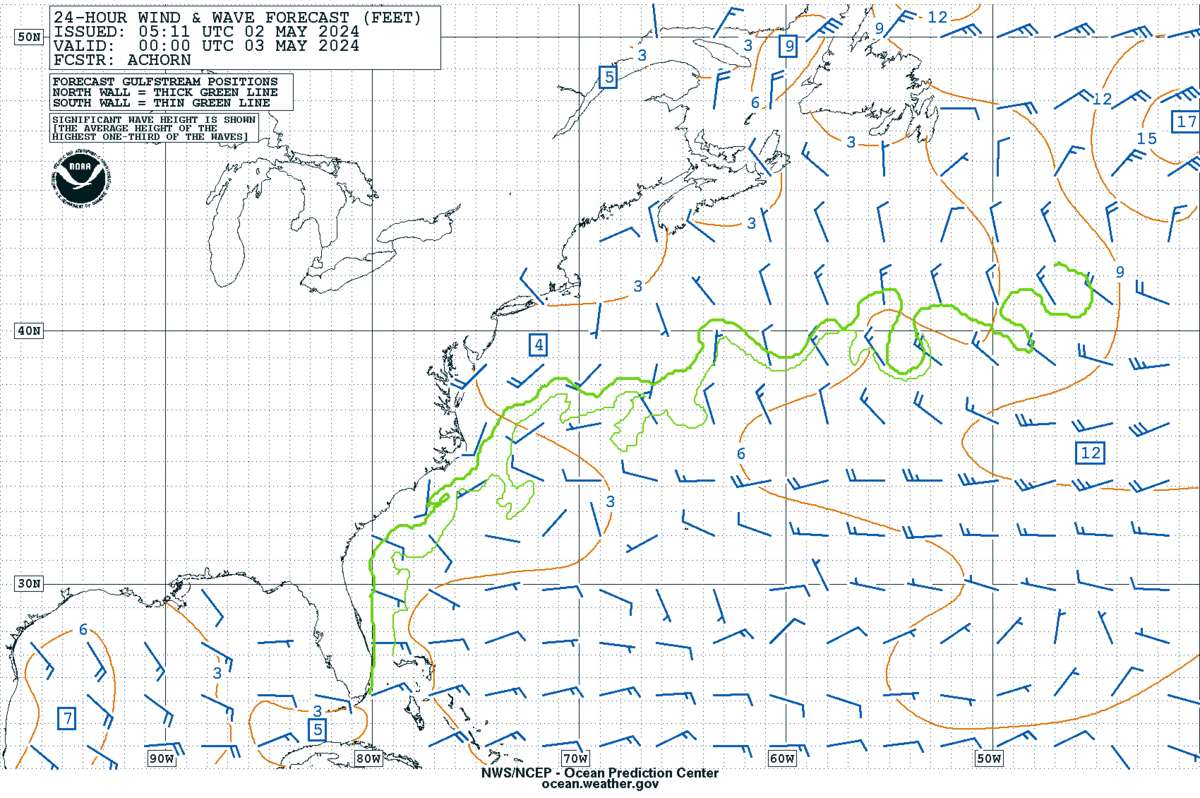
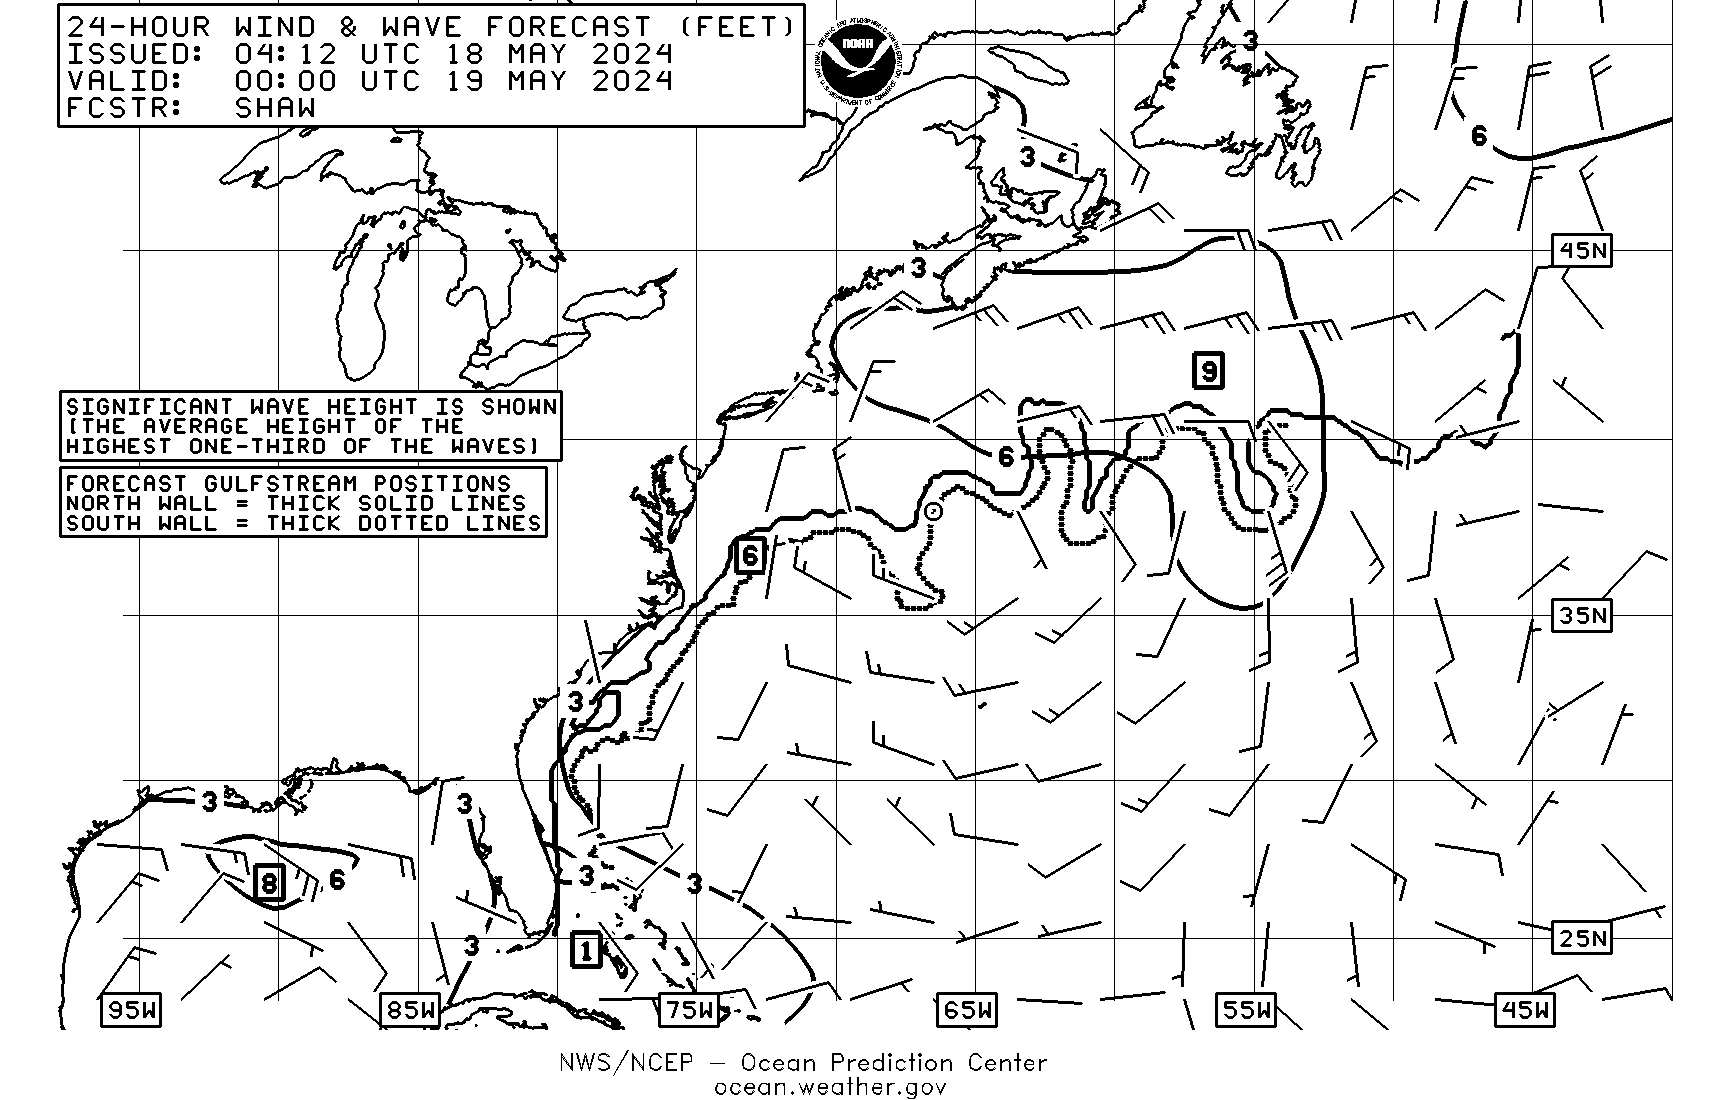
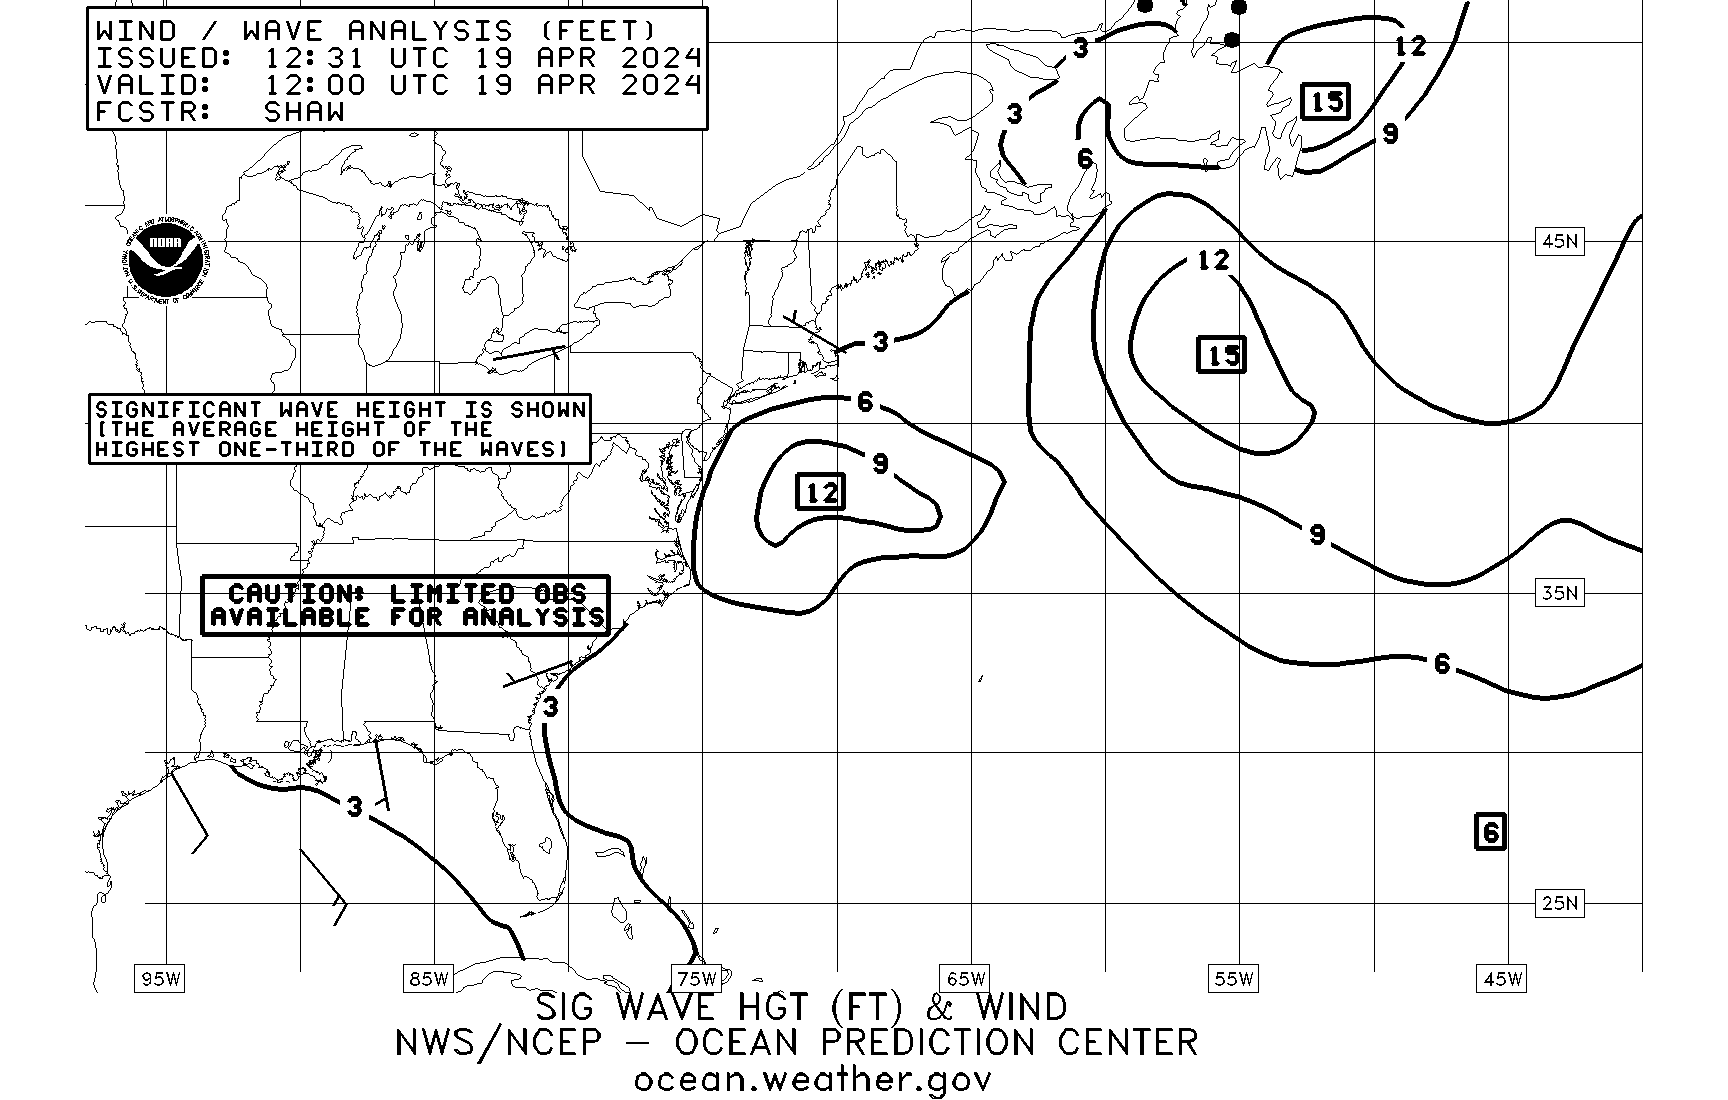
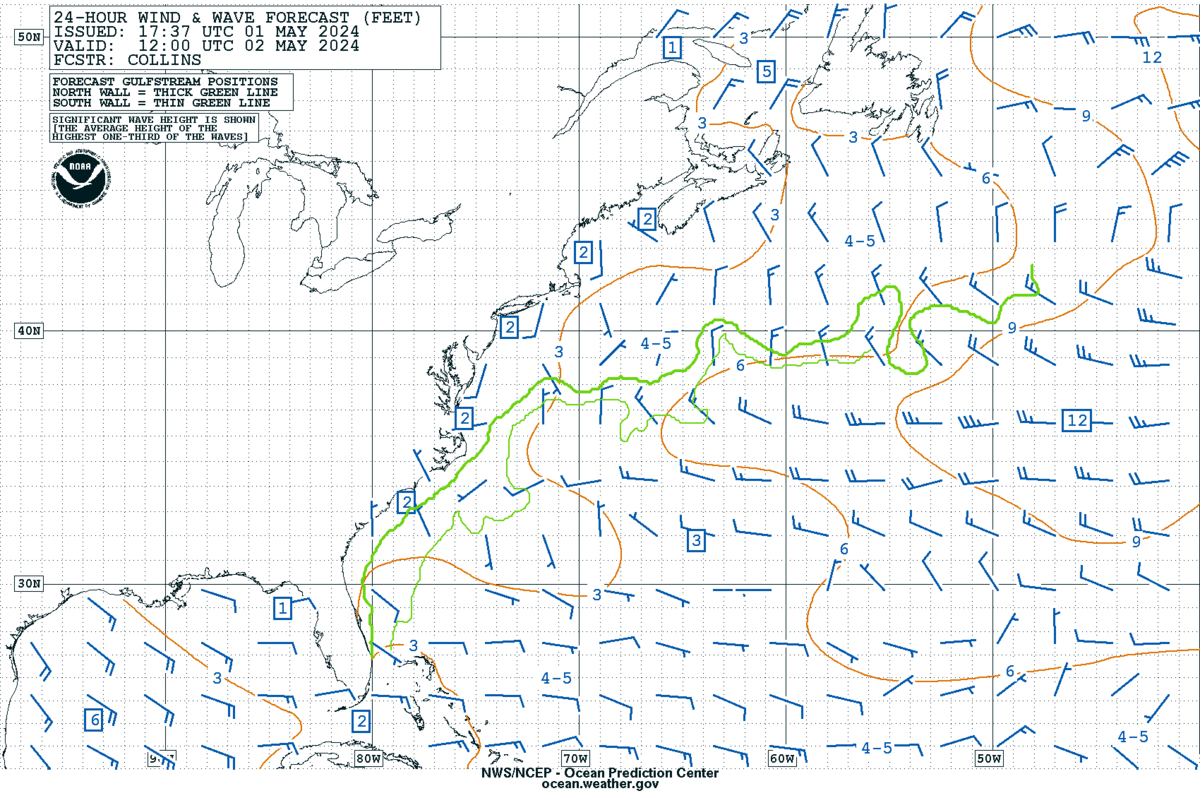
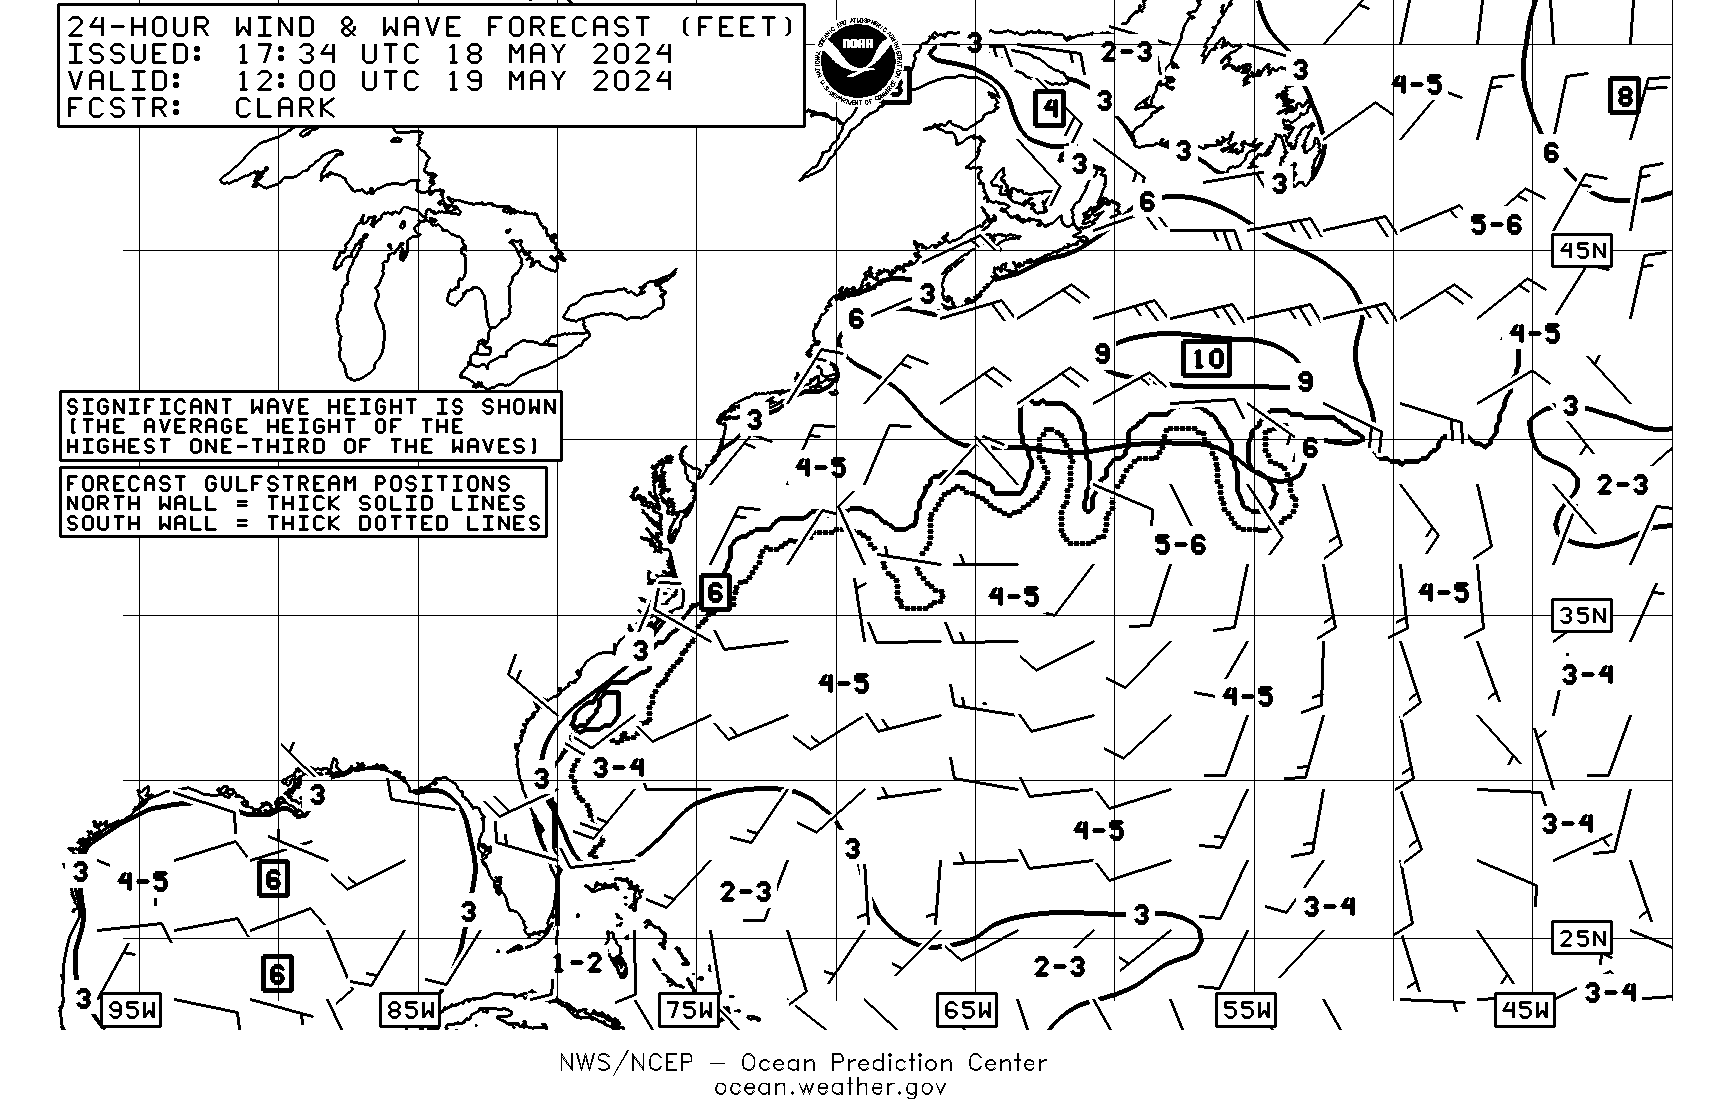
| 0815Z | 24Hr Wind&Wave VT 00Z (15N-65N, 10E-95W) | PWAE98 | TIF|GIF|B/W GIF | 05:17Z Jul 20 2026 |
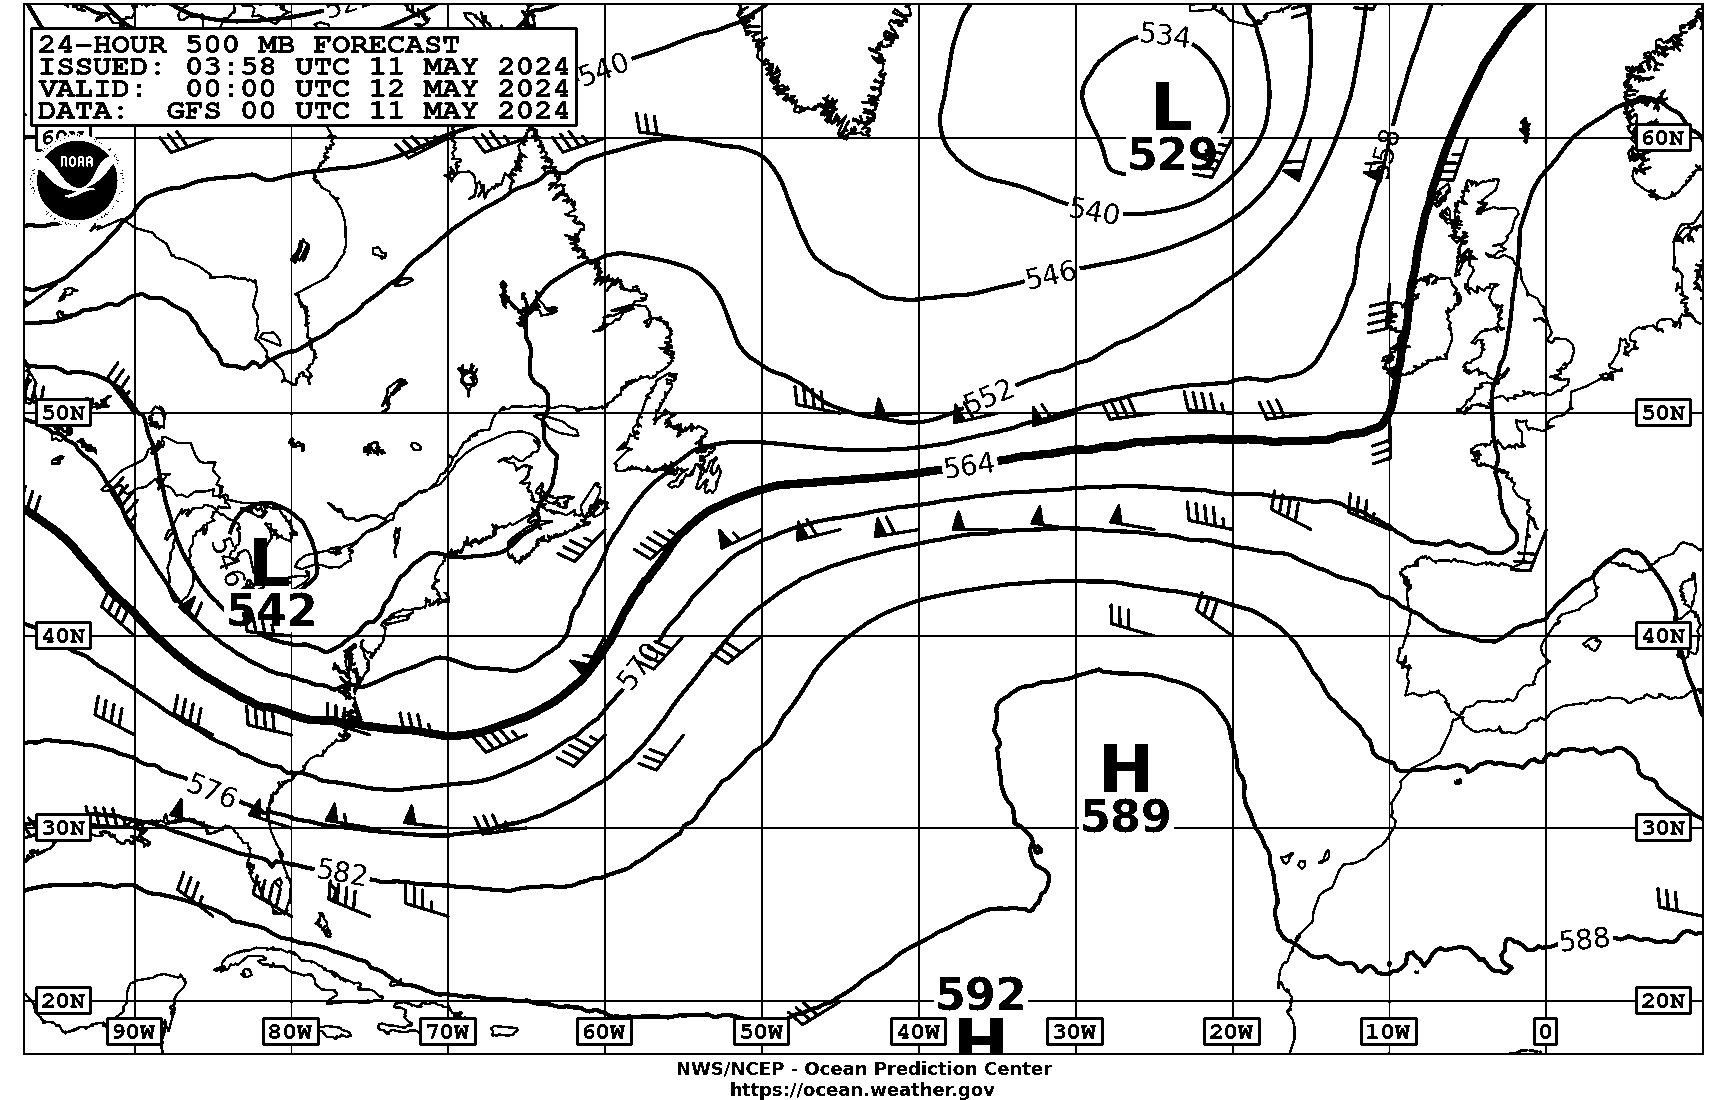
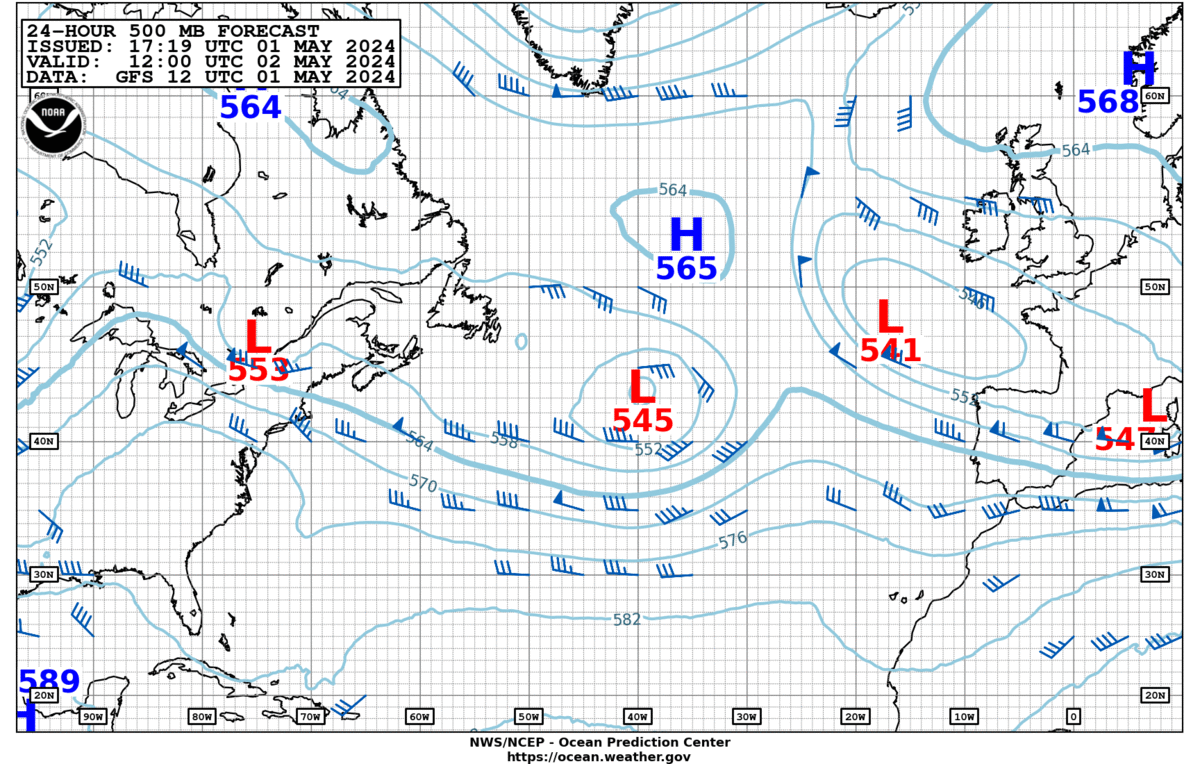
| 0825Z | 24Hr 500mb VT 00Z (15N-65N, 10E-95W) | PPAE50 | TIF|GIF|B/W GIF | 03:59Z Jul 20 2026 |
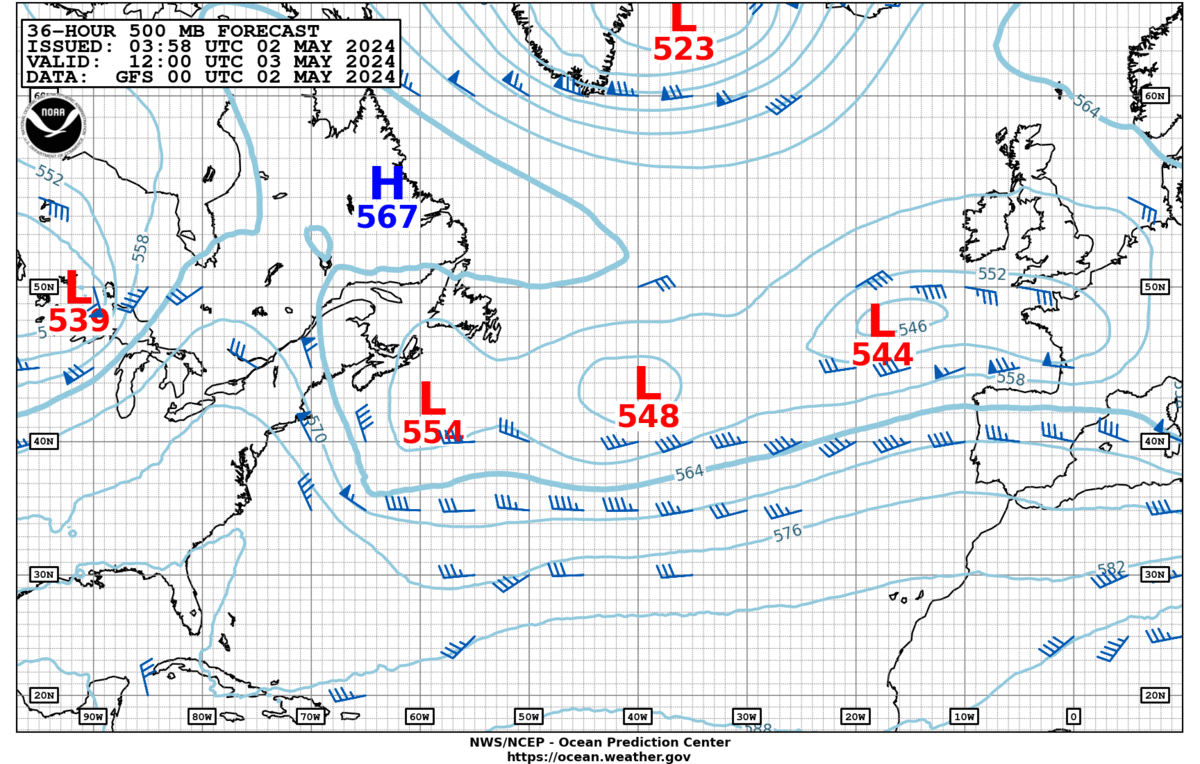
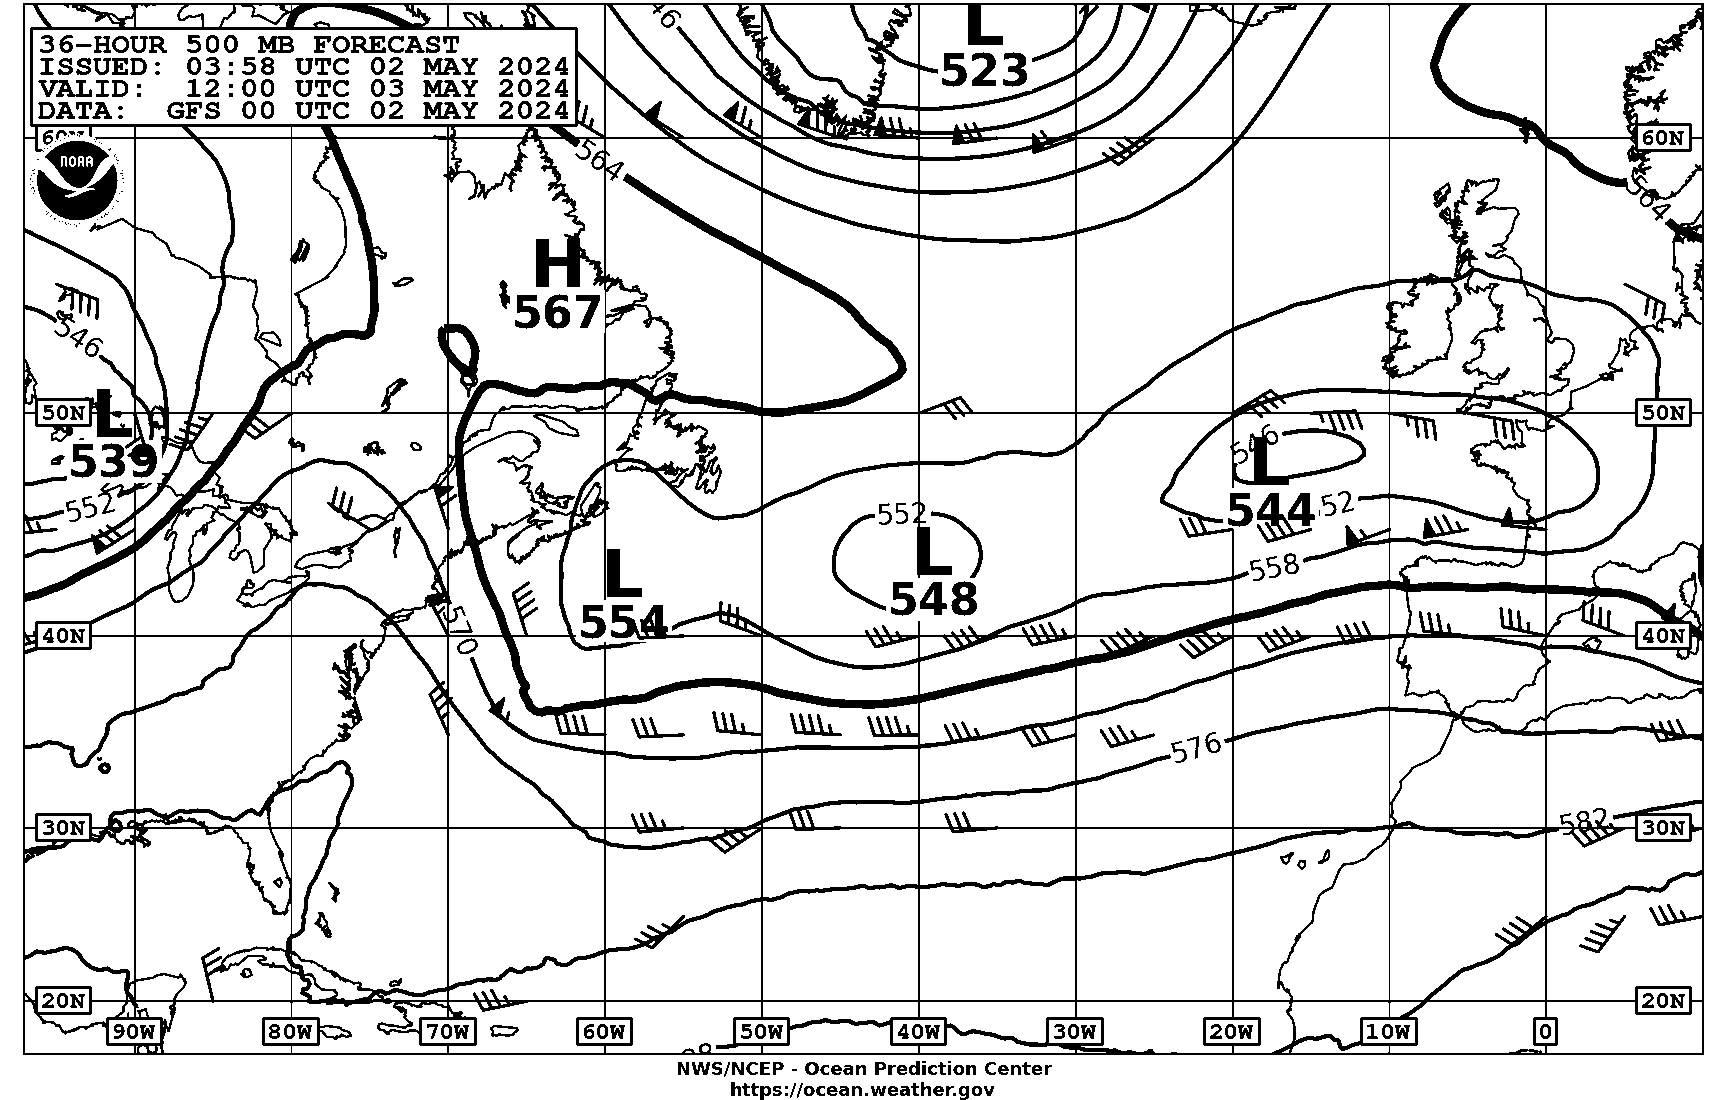
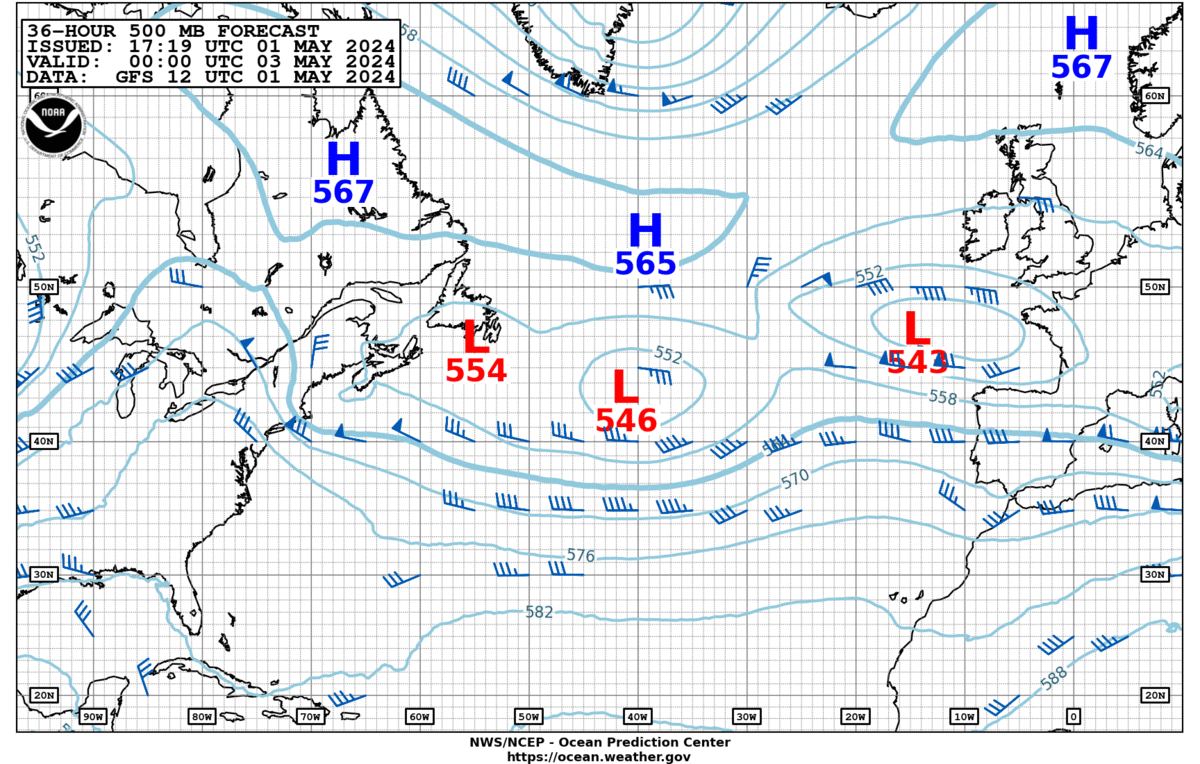
| 0835Z | 36Hr 500mb VT 00Z (15N-65N, 10E-95W) | PPAG50 | TIF|GIF|B/W GIF | 03:59Z Jul 20 2026 |
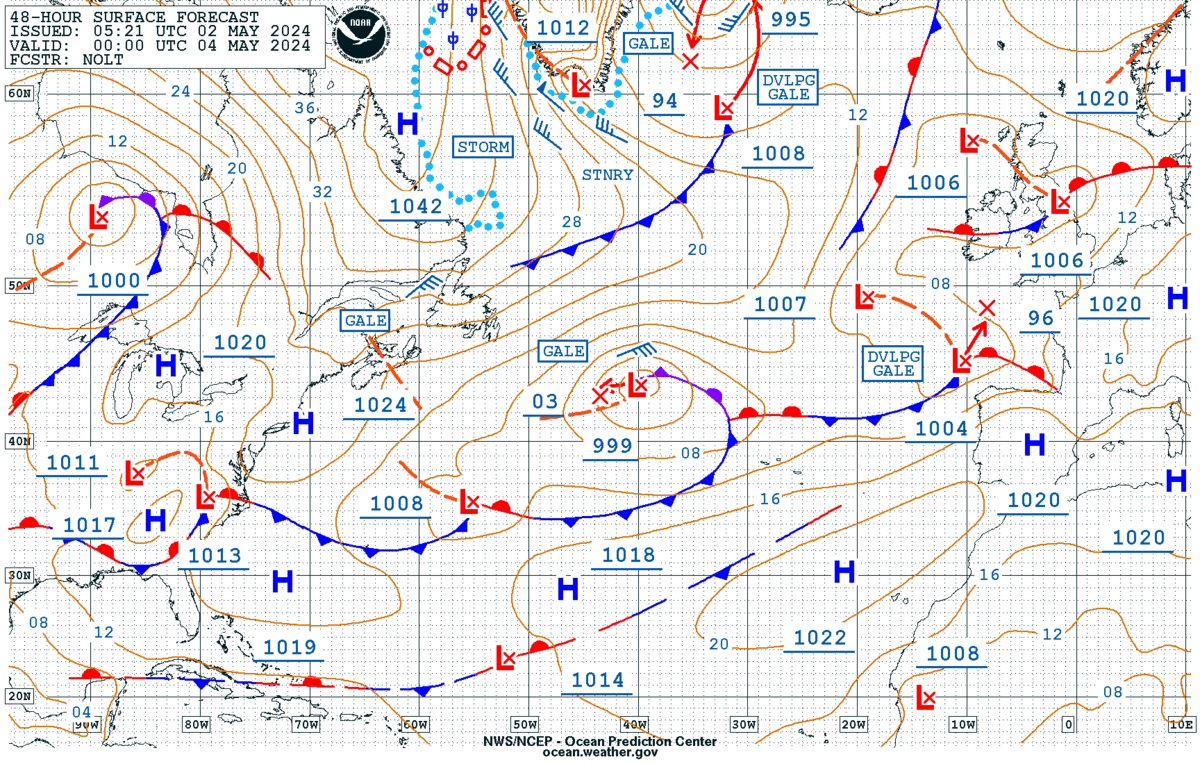
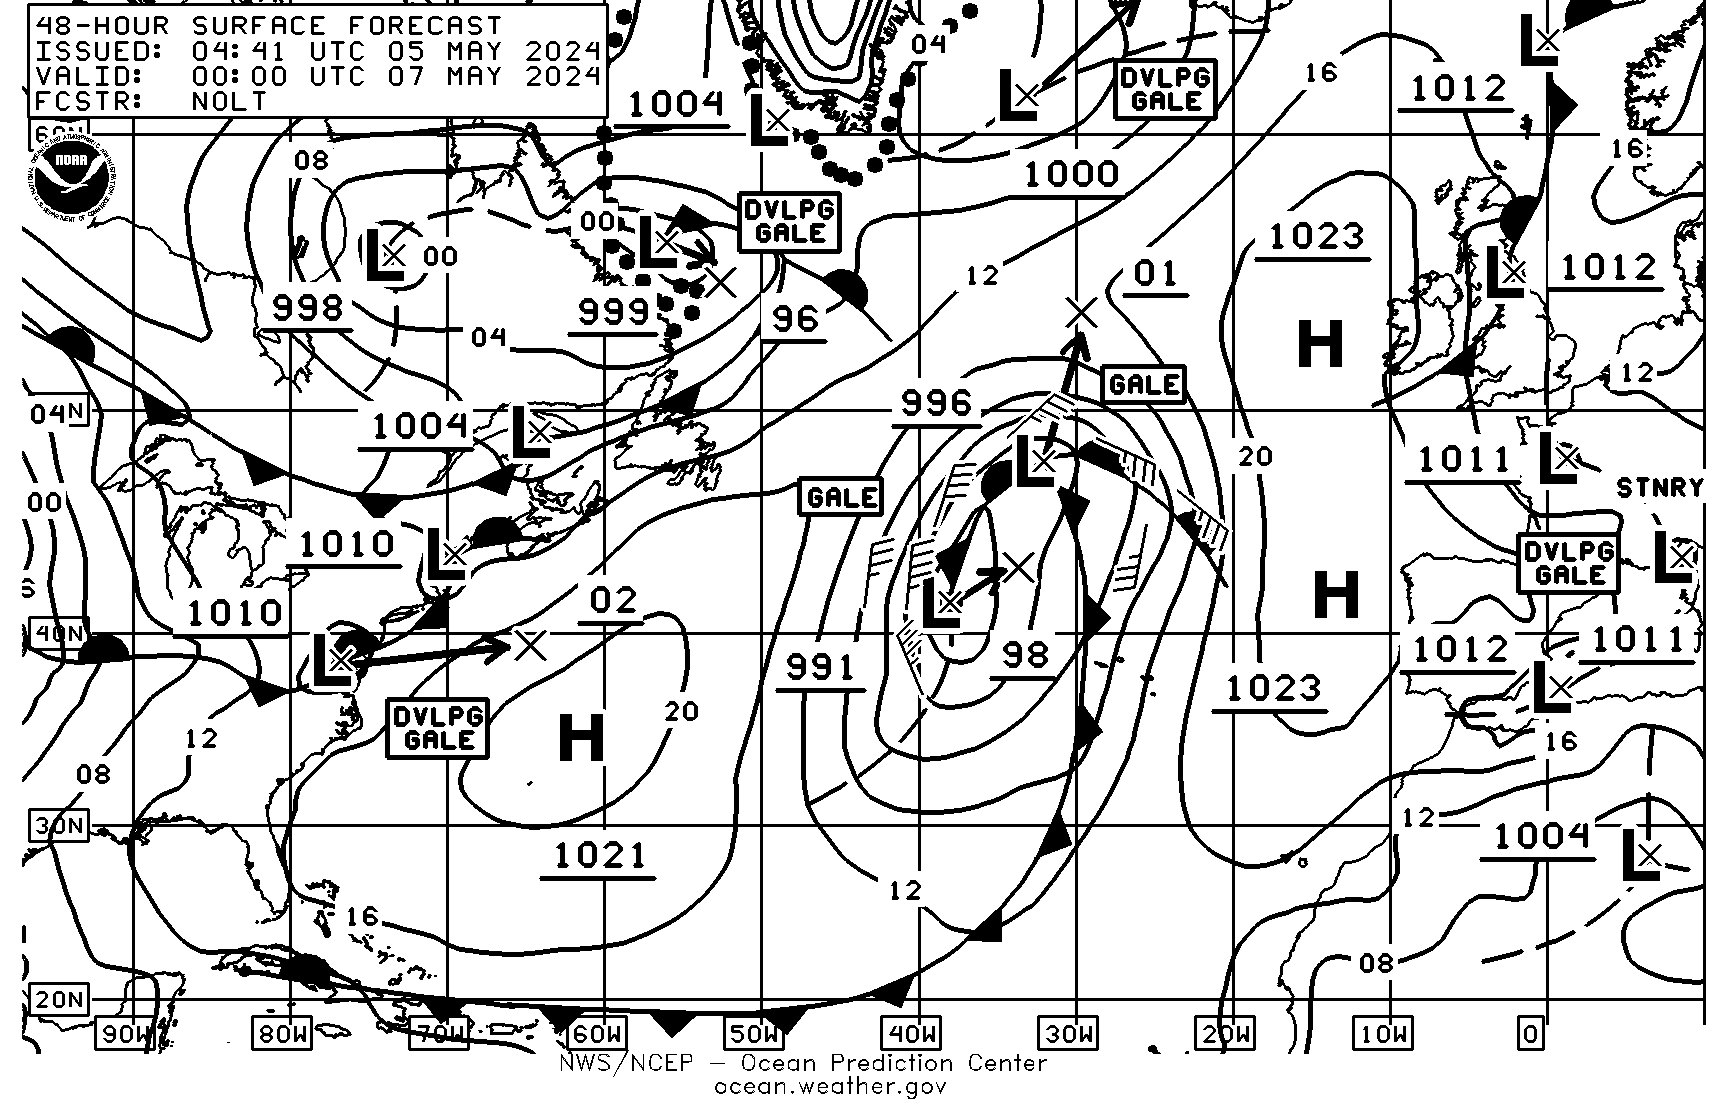
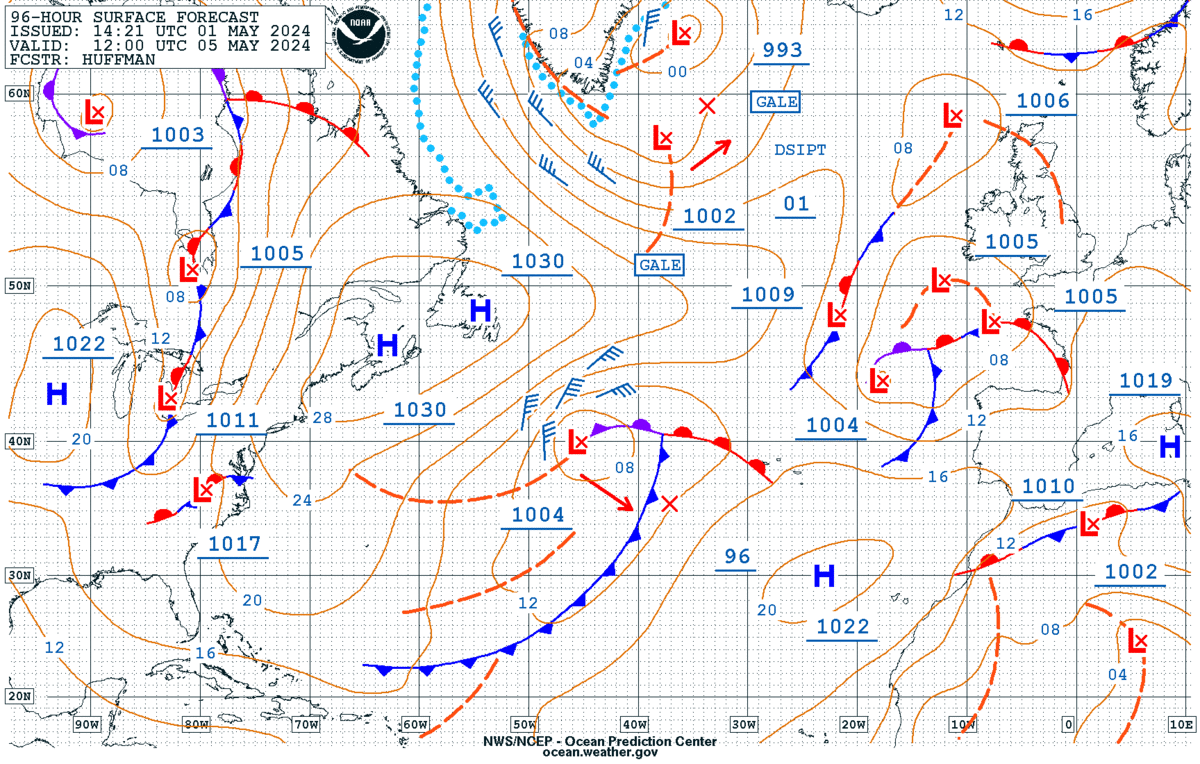
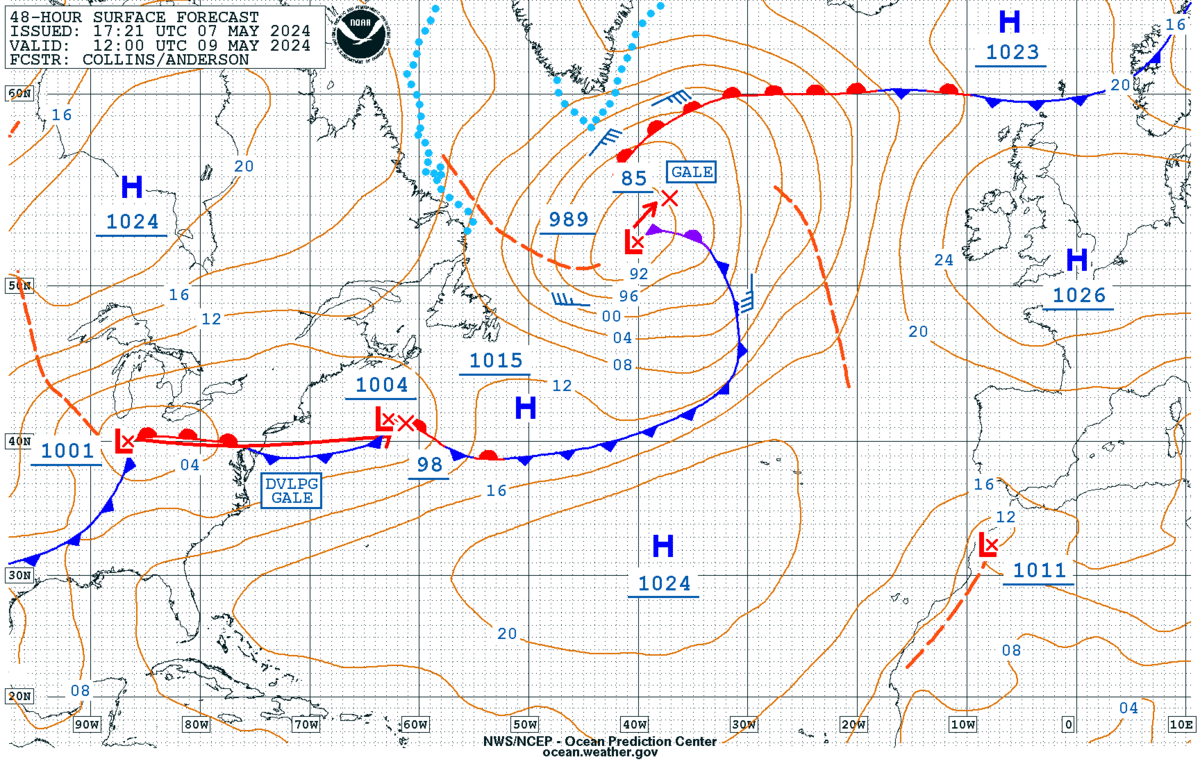
| 0845Z | 48Hr Surface/Ice Accretion VT 00Z (15N-65N, 10E-95W) | QDTM85 | TIF|GIF|B/W GIF | 05:06Z Jul 20 2026 |
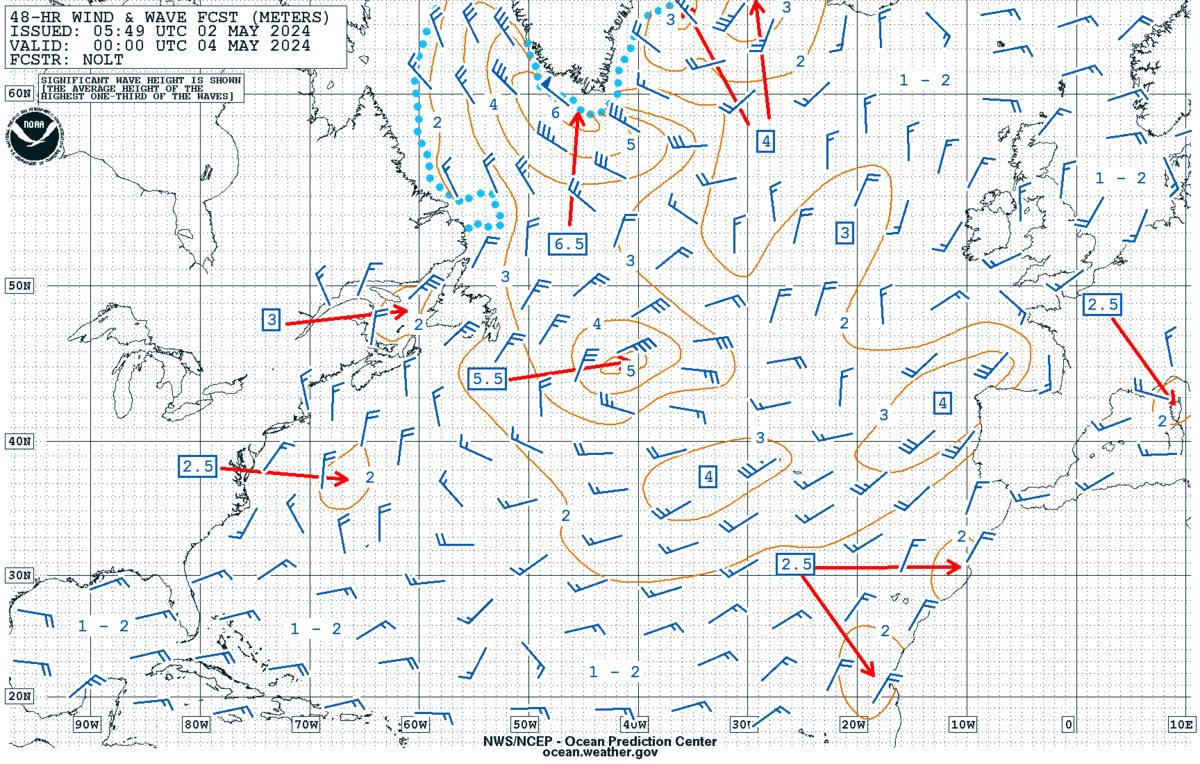
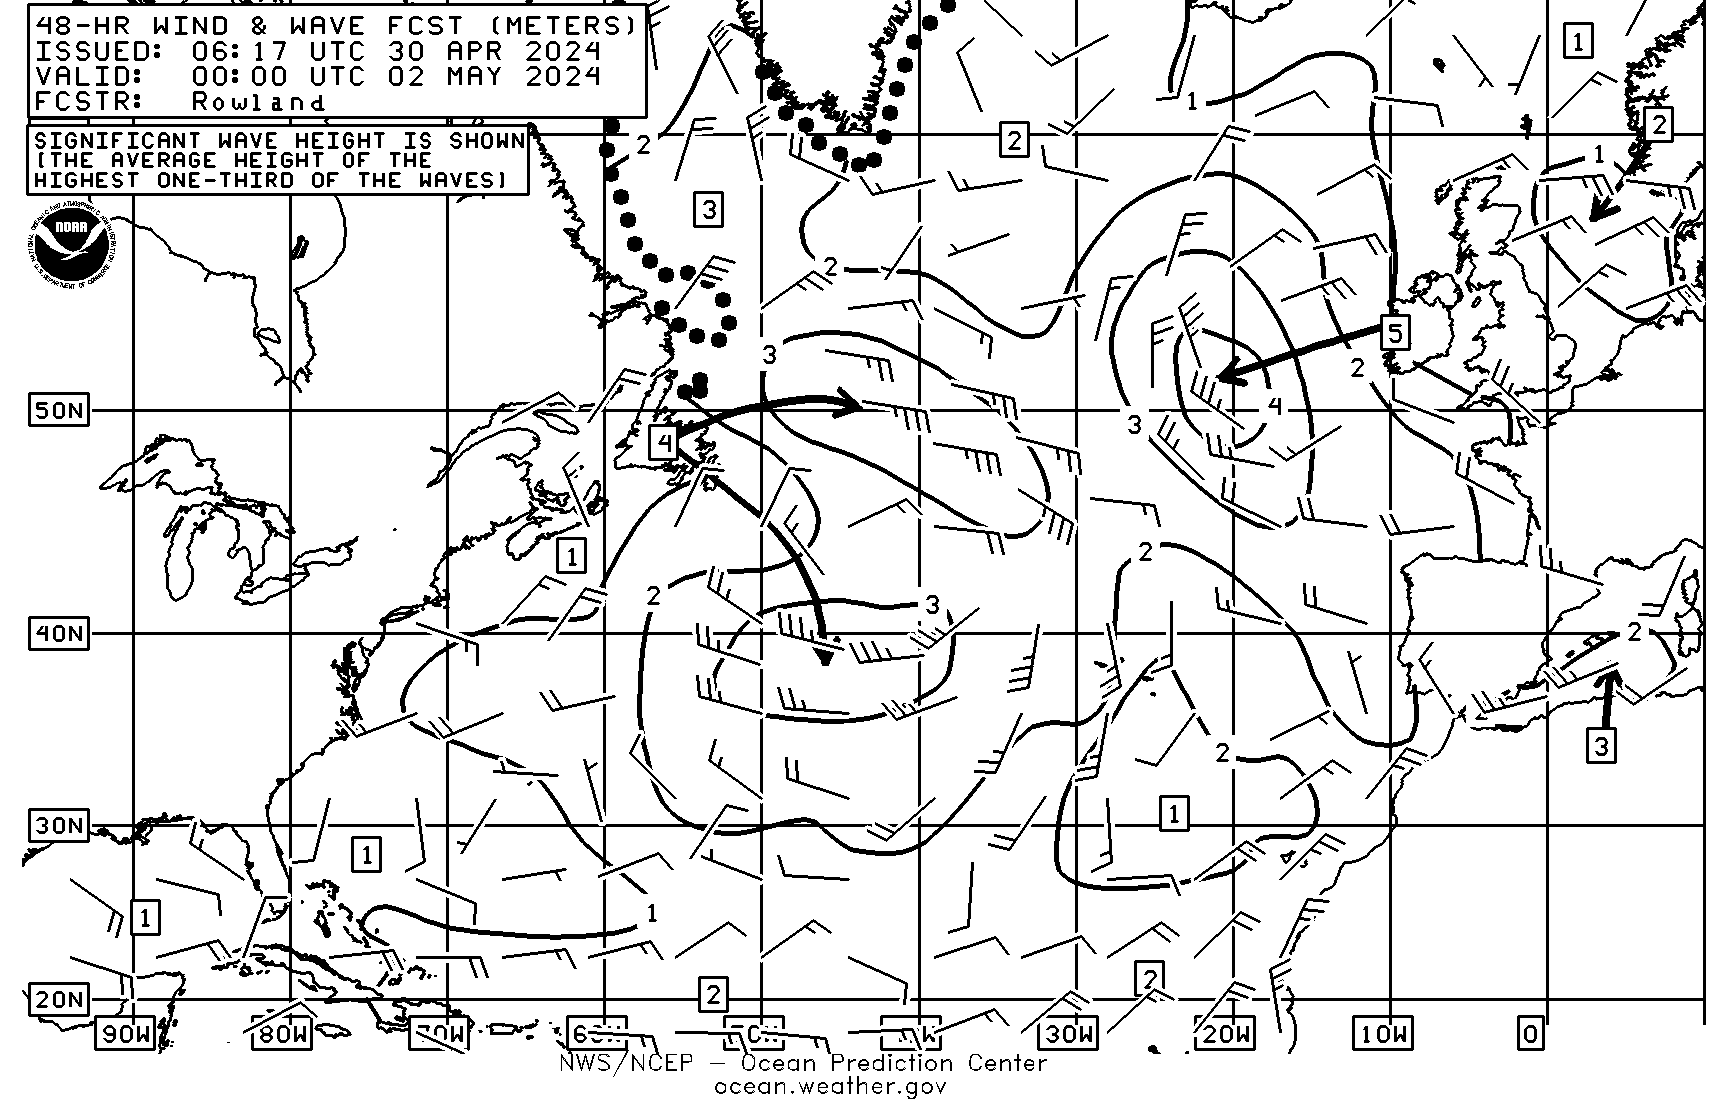
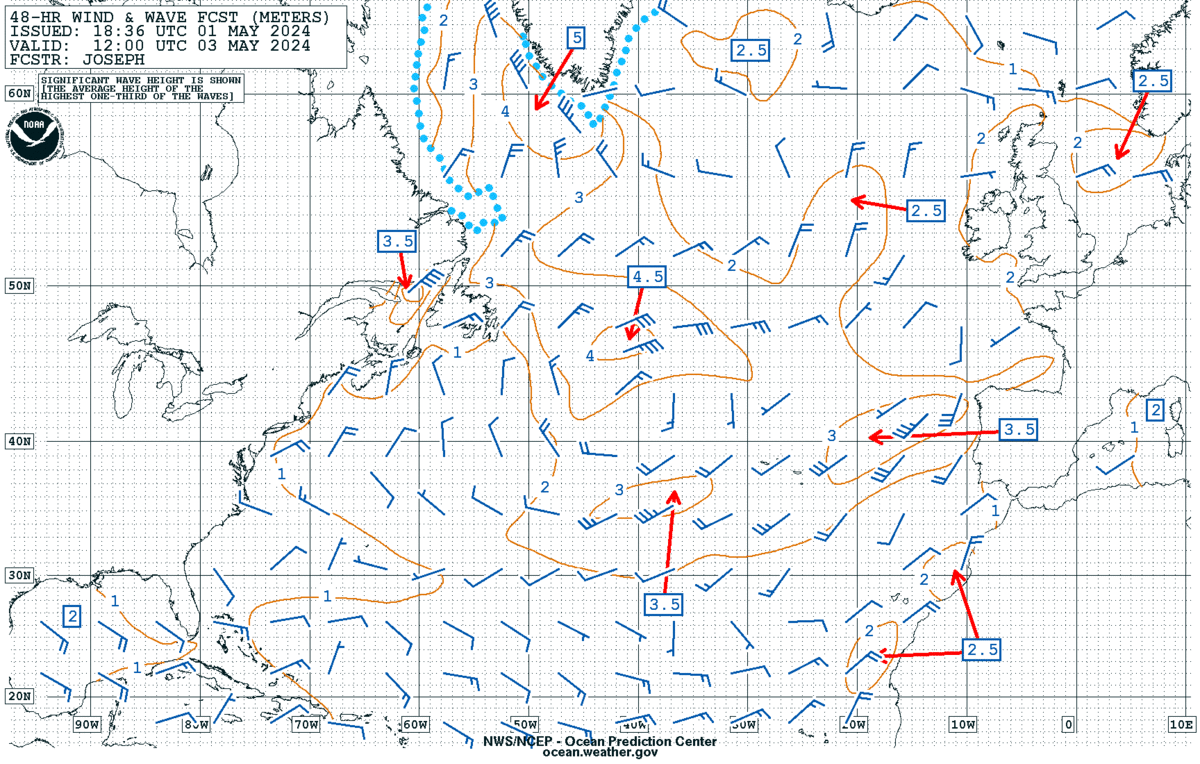
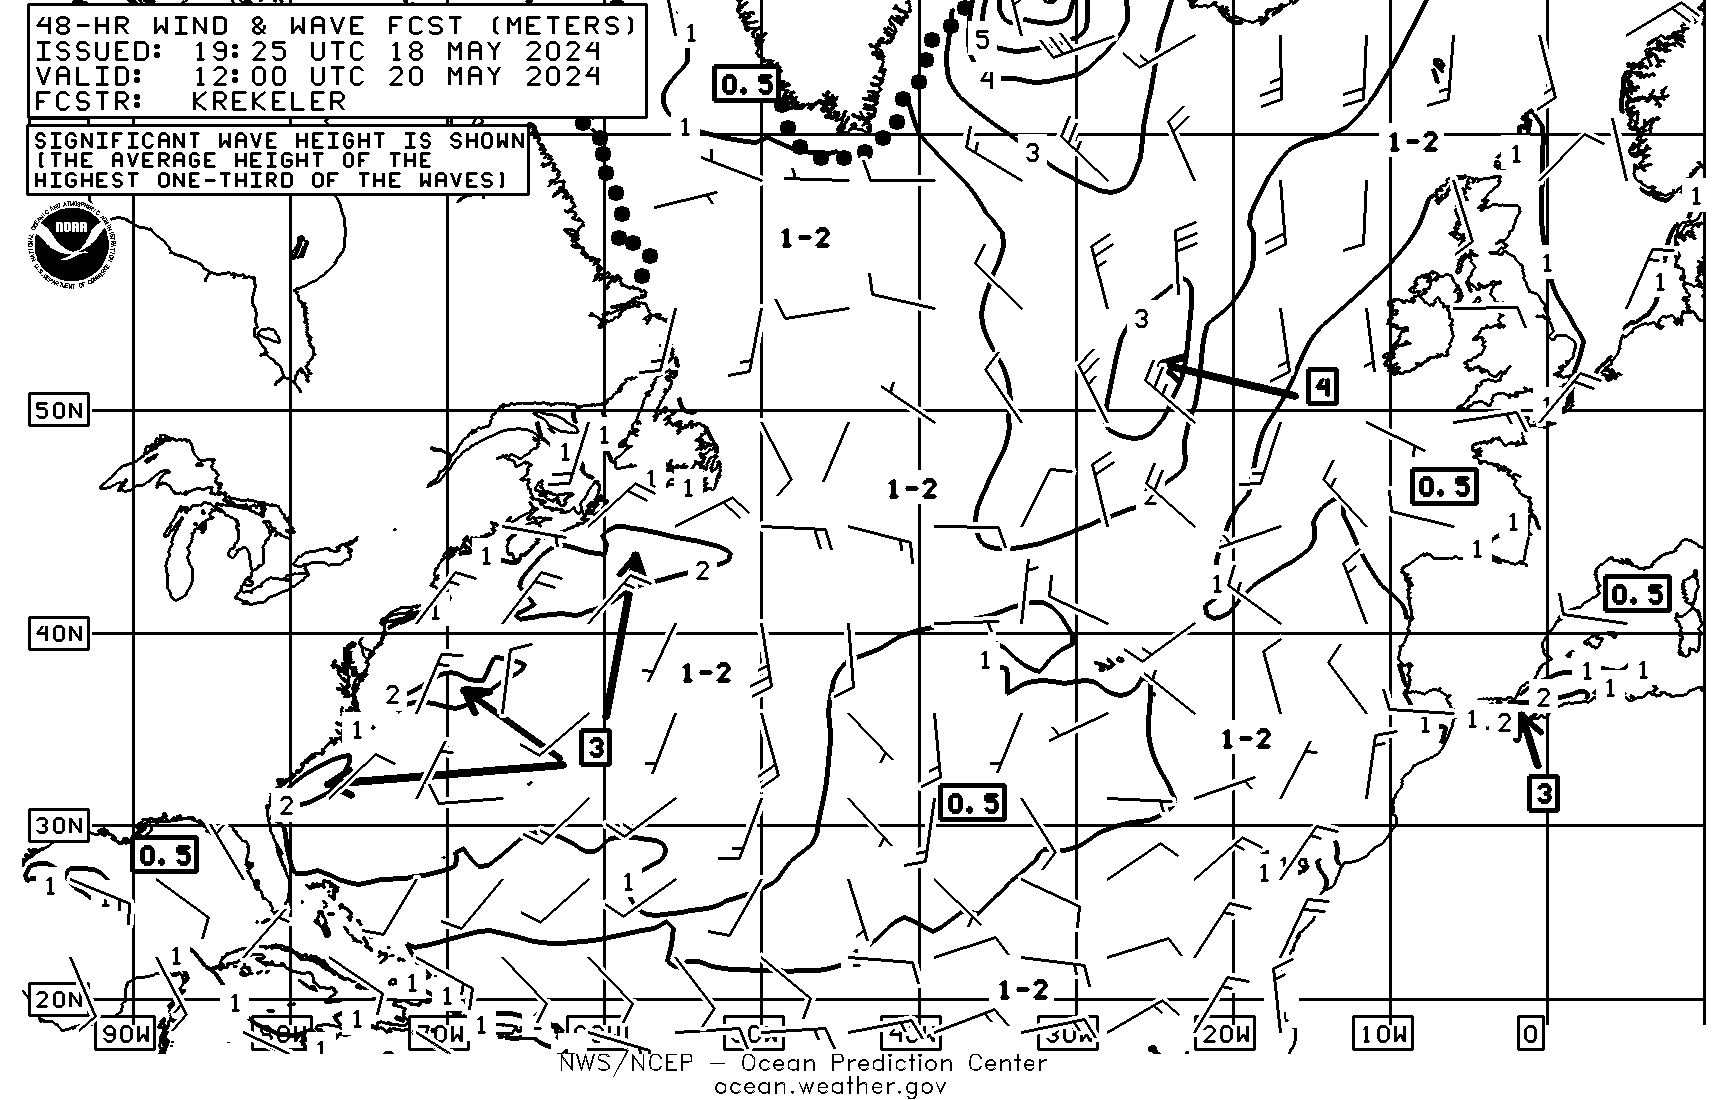
| 0855Z | 48Hr Wind&Wave VT 00Z (15N-65N, 10E-95W) | PJAI98 | TIF|GIF|B/W GIF | 05:27Z Jul 20 2026 |
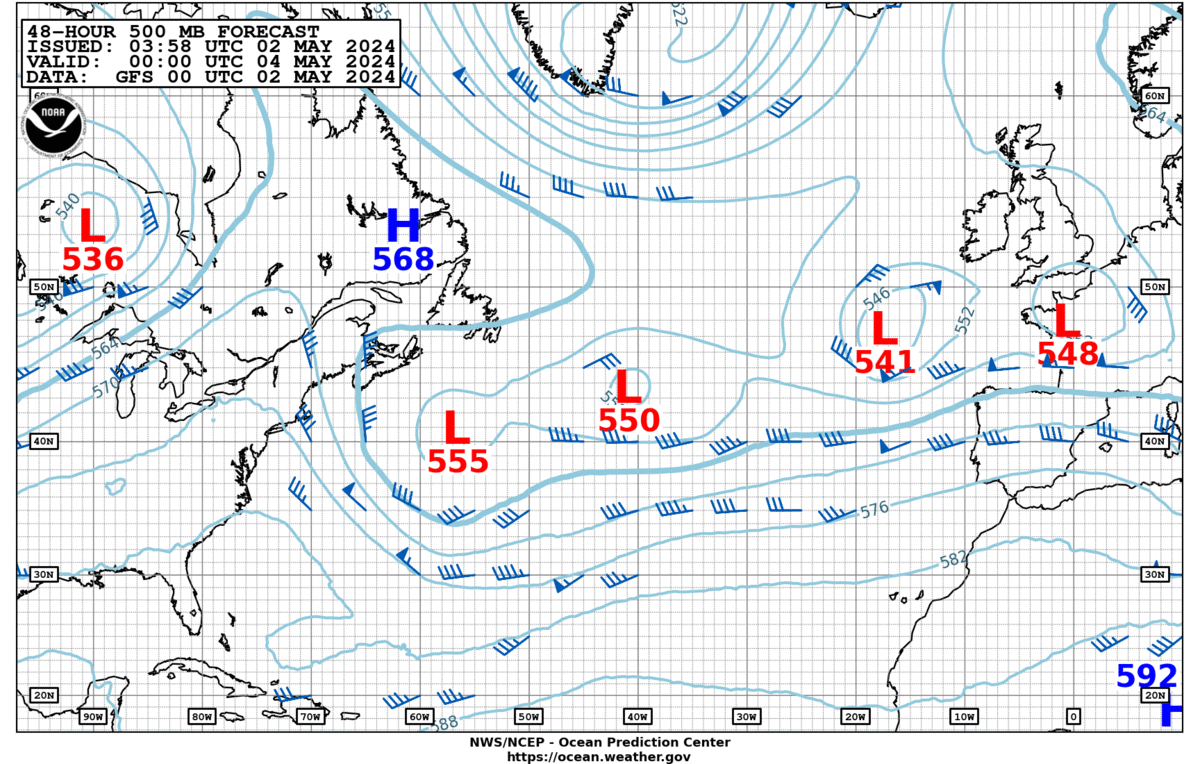
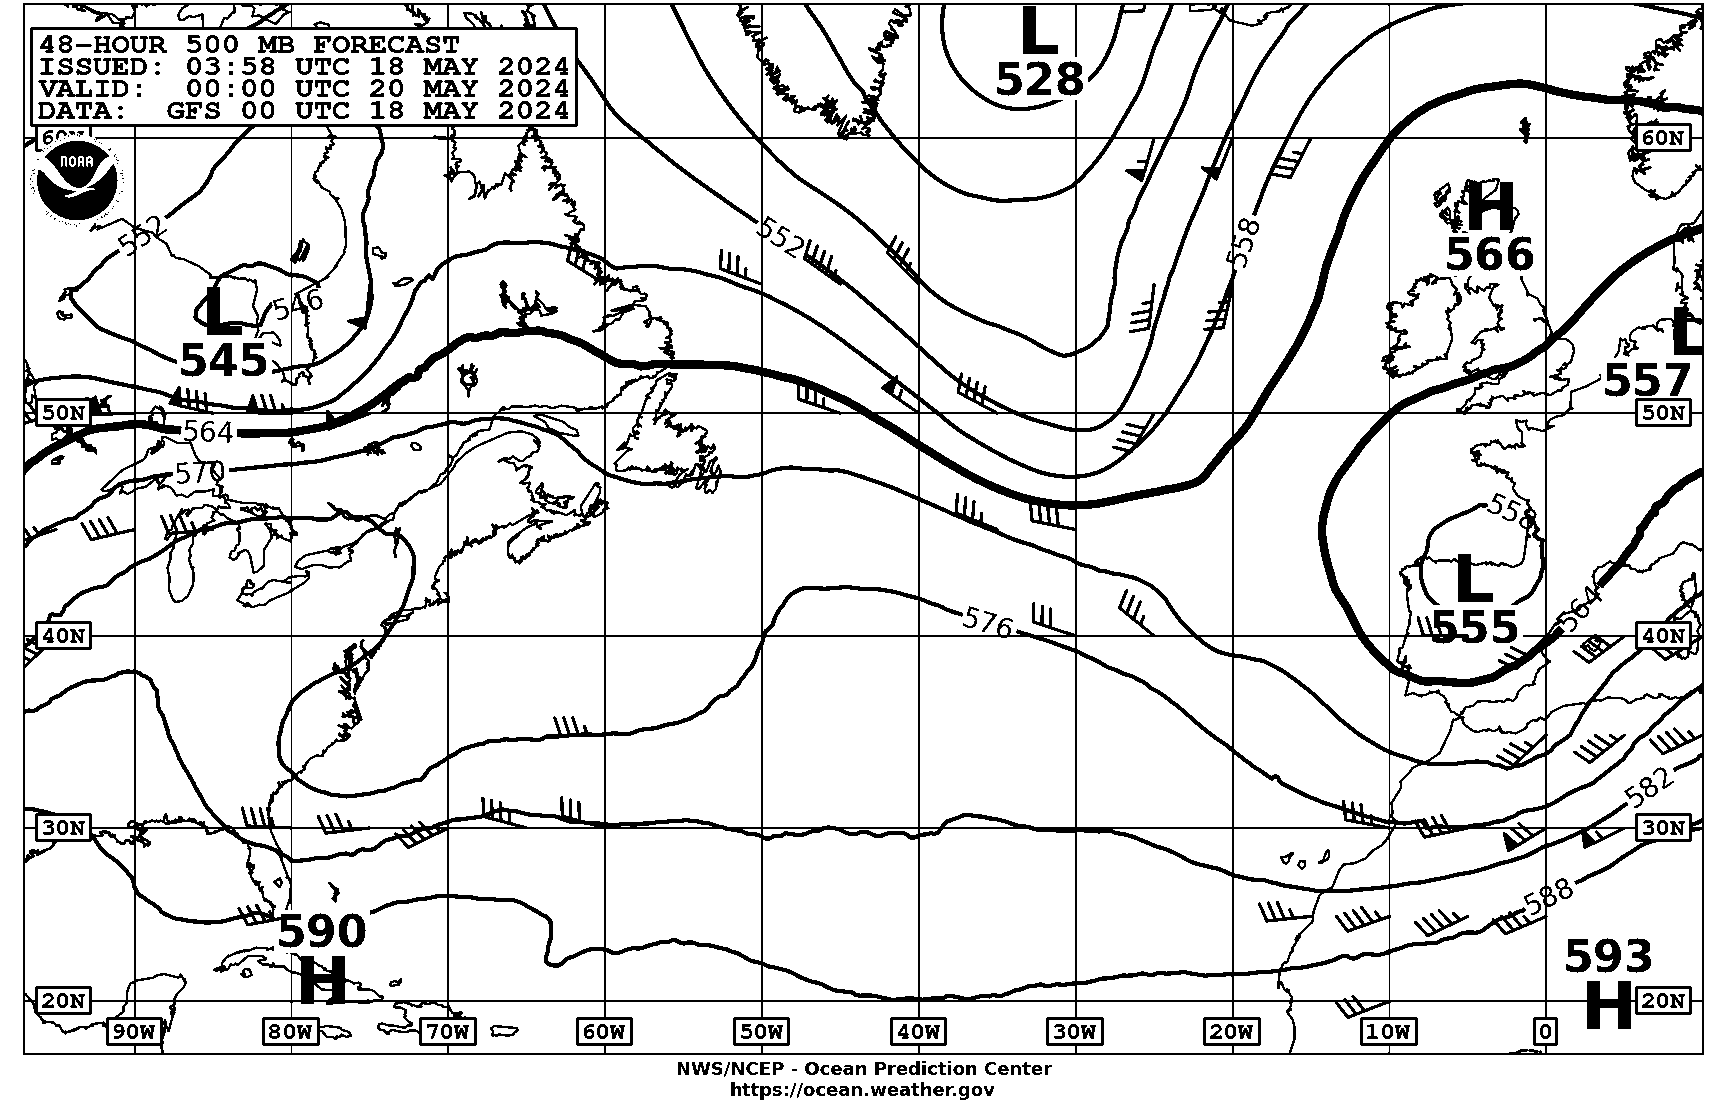
| 0905Z | 48Hr 500mb VT 00Z (15N-65N, 10E-95W) | PPAI50 | TIF|GIF|B/W GIF | 04:00Z Jul 20 2026 |
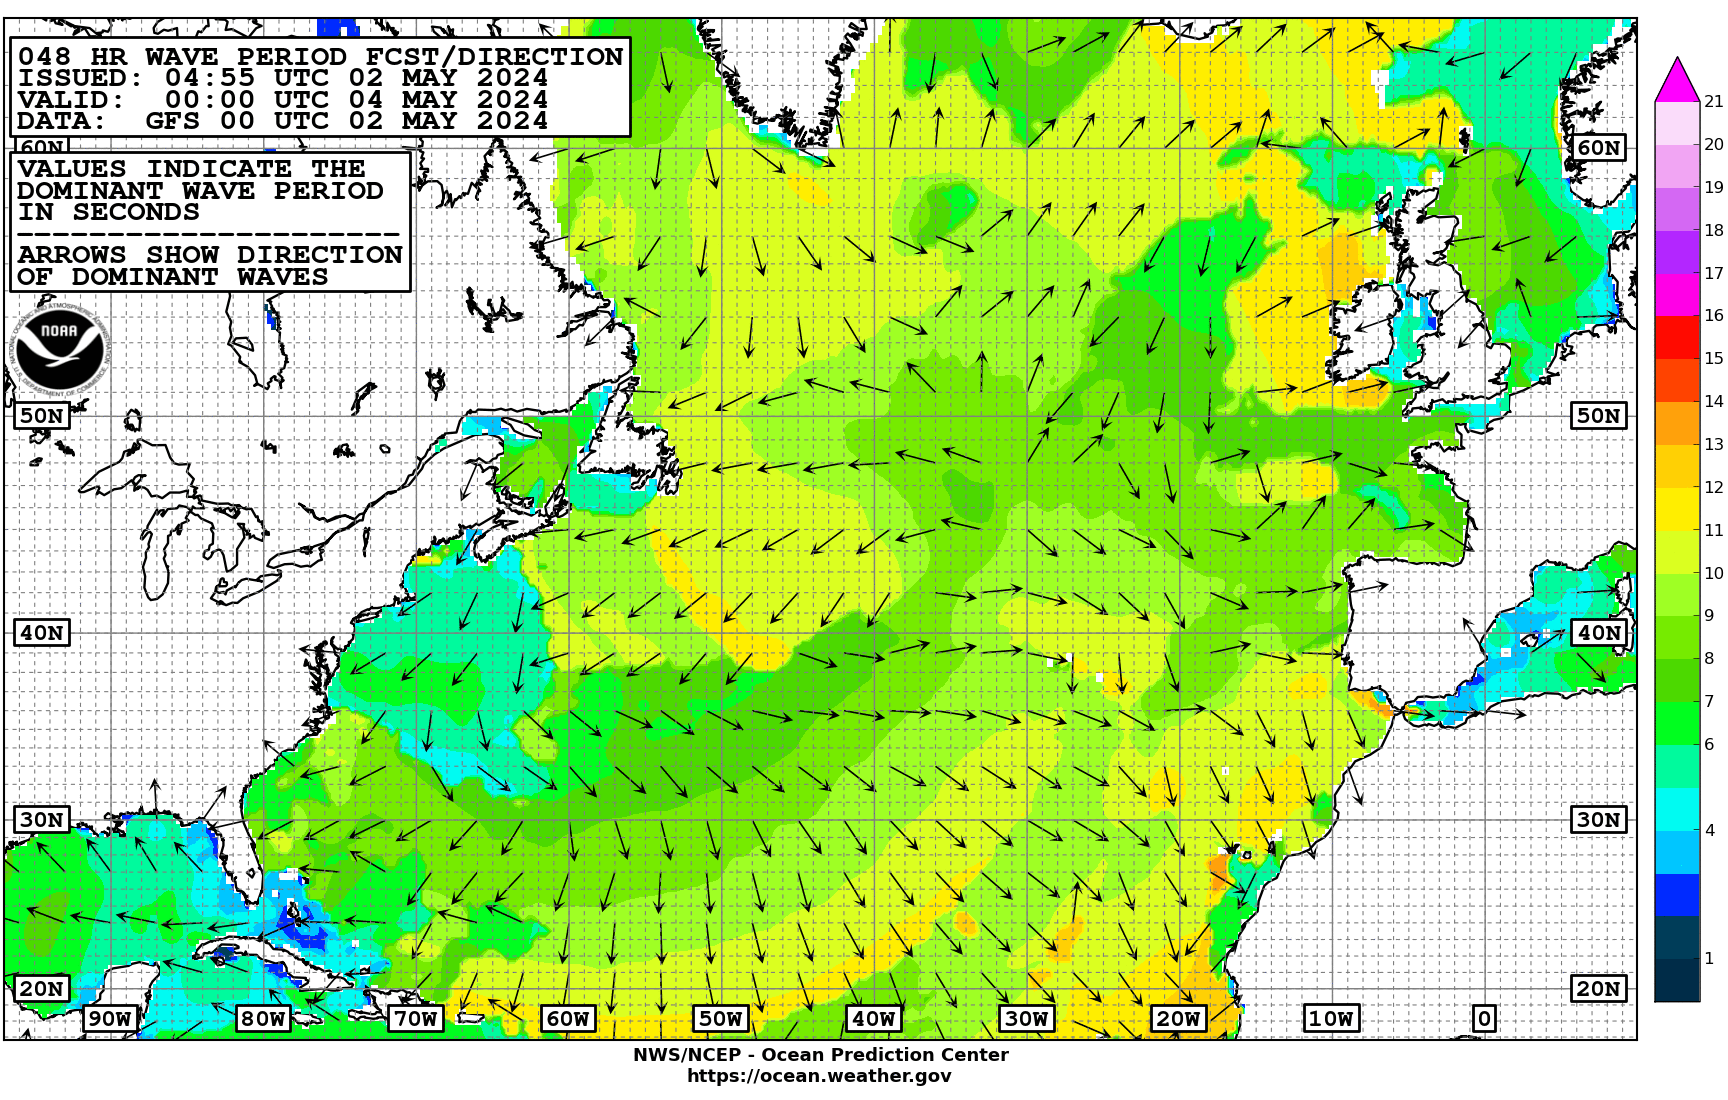
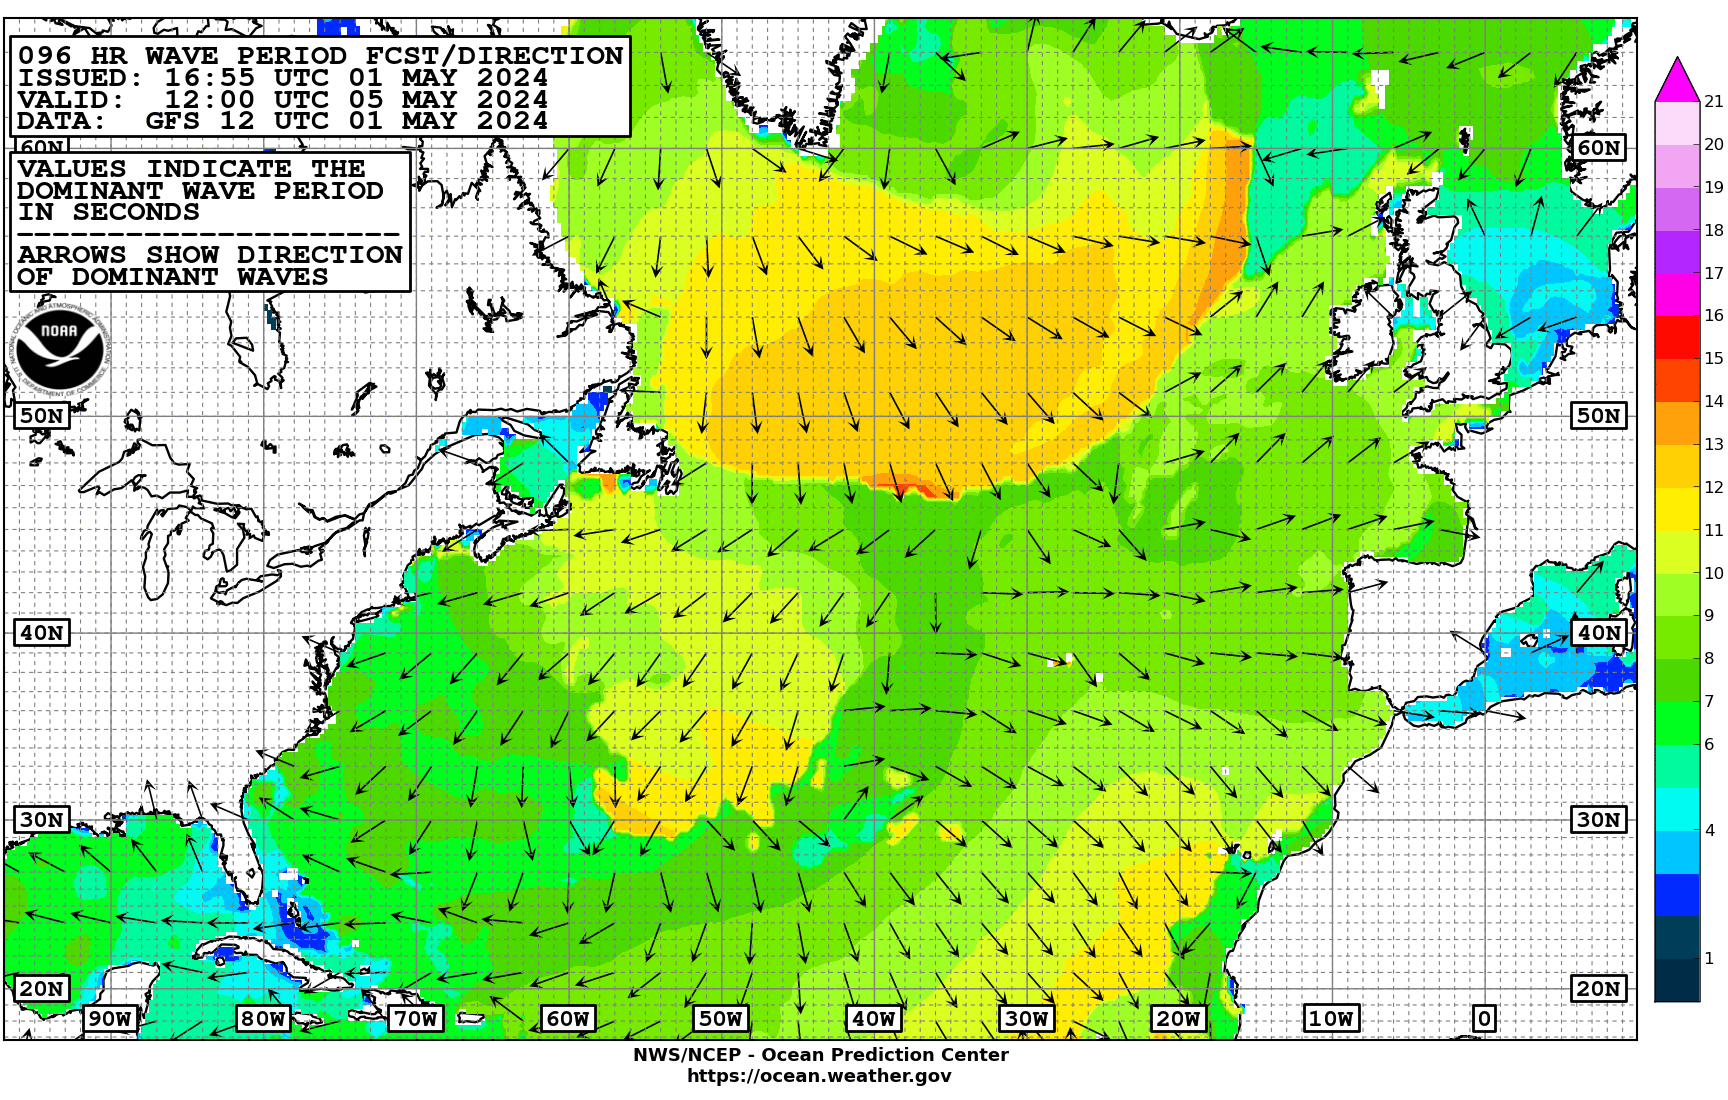
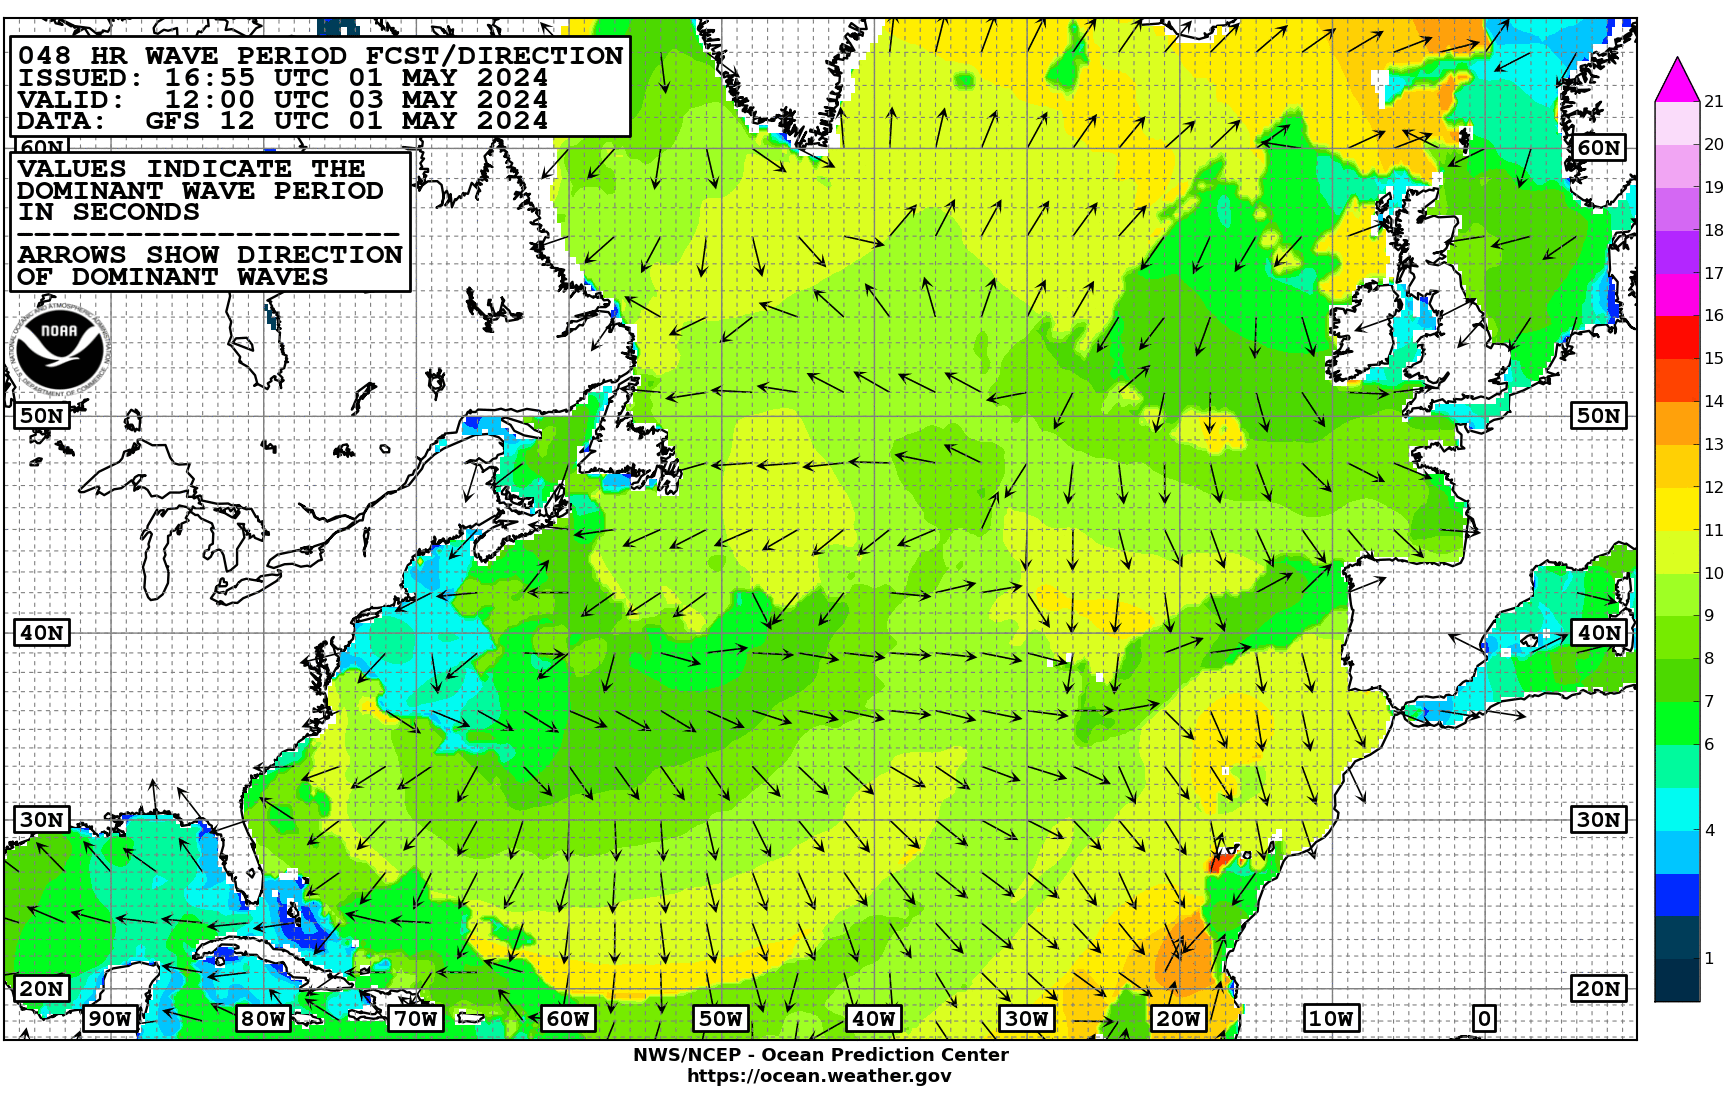
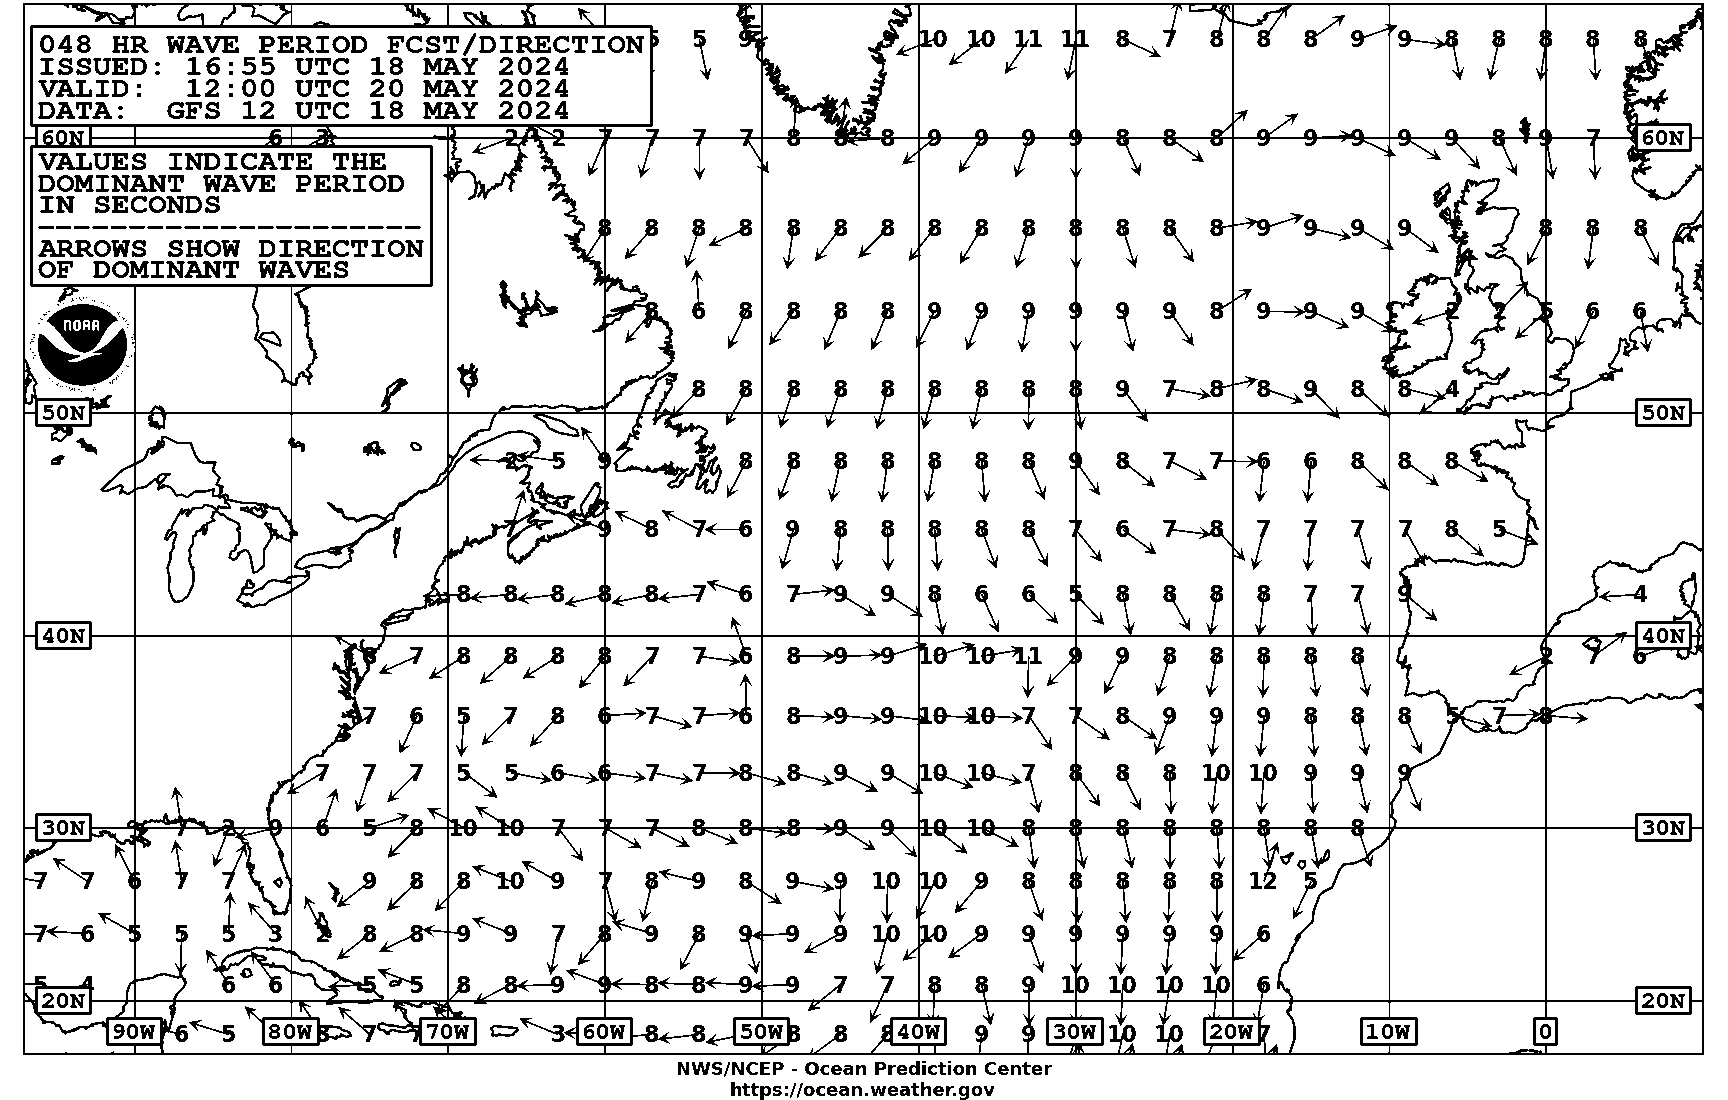
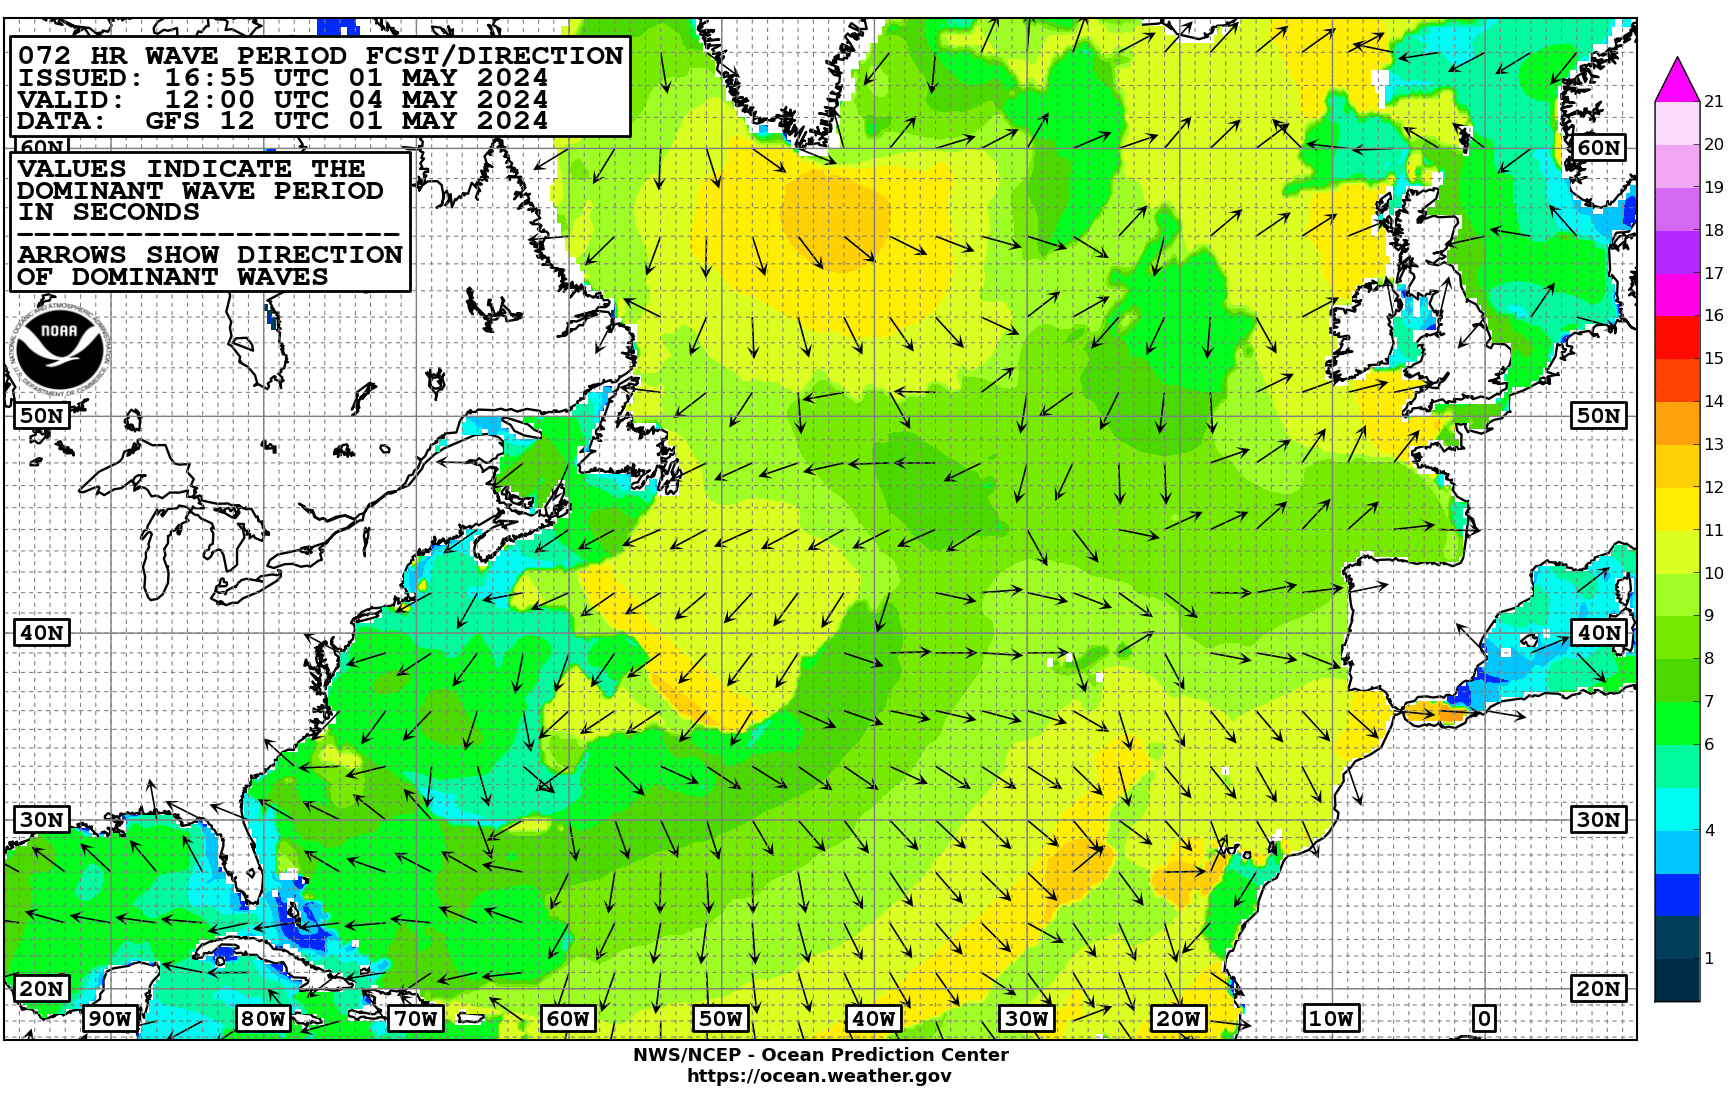
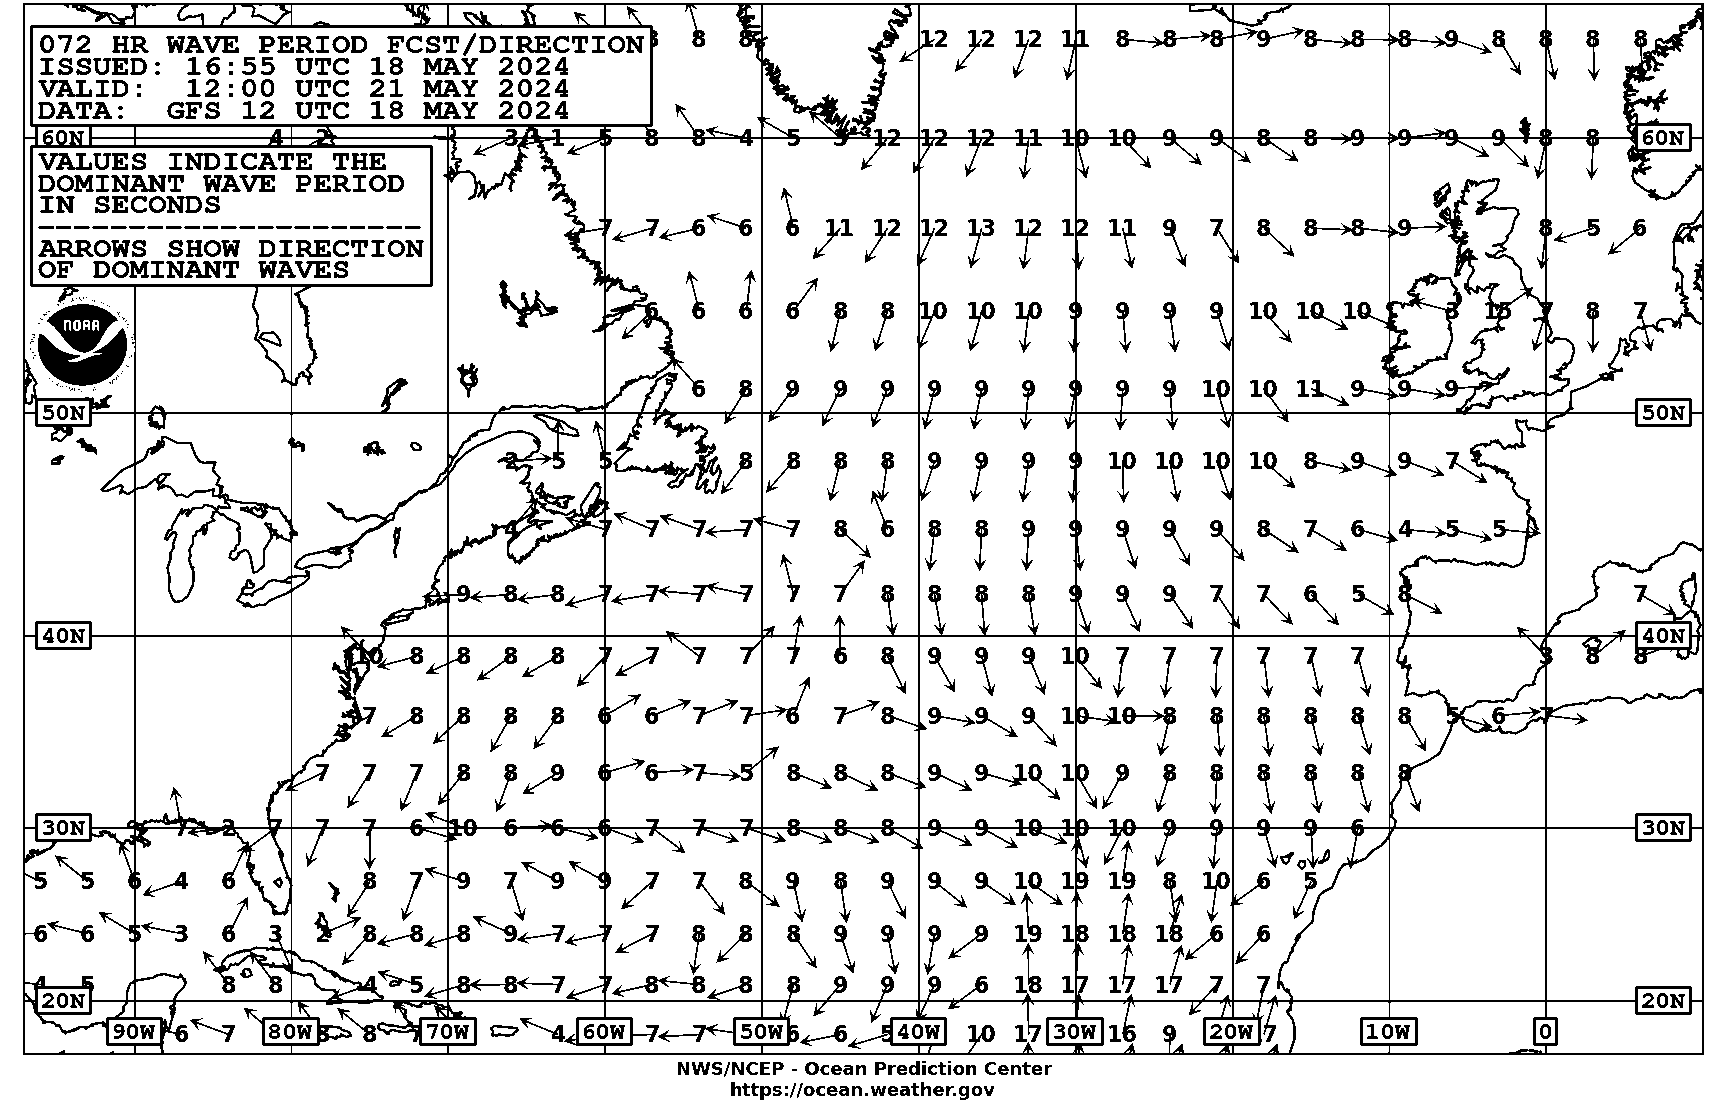
| 0915Z | 48Hr Peak Wave Period&Direction VT 00Z (15N-65N, 10E-95W) | PJAI88 | TIF|GIF|B/W GIF | 04:56Z Jul 20 2026 |
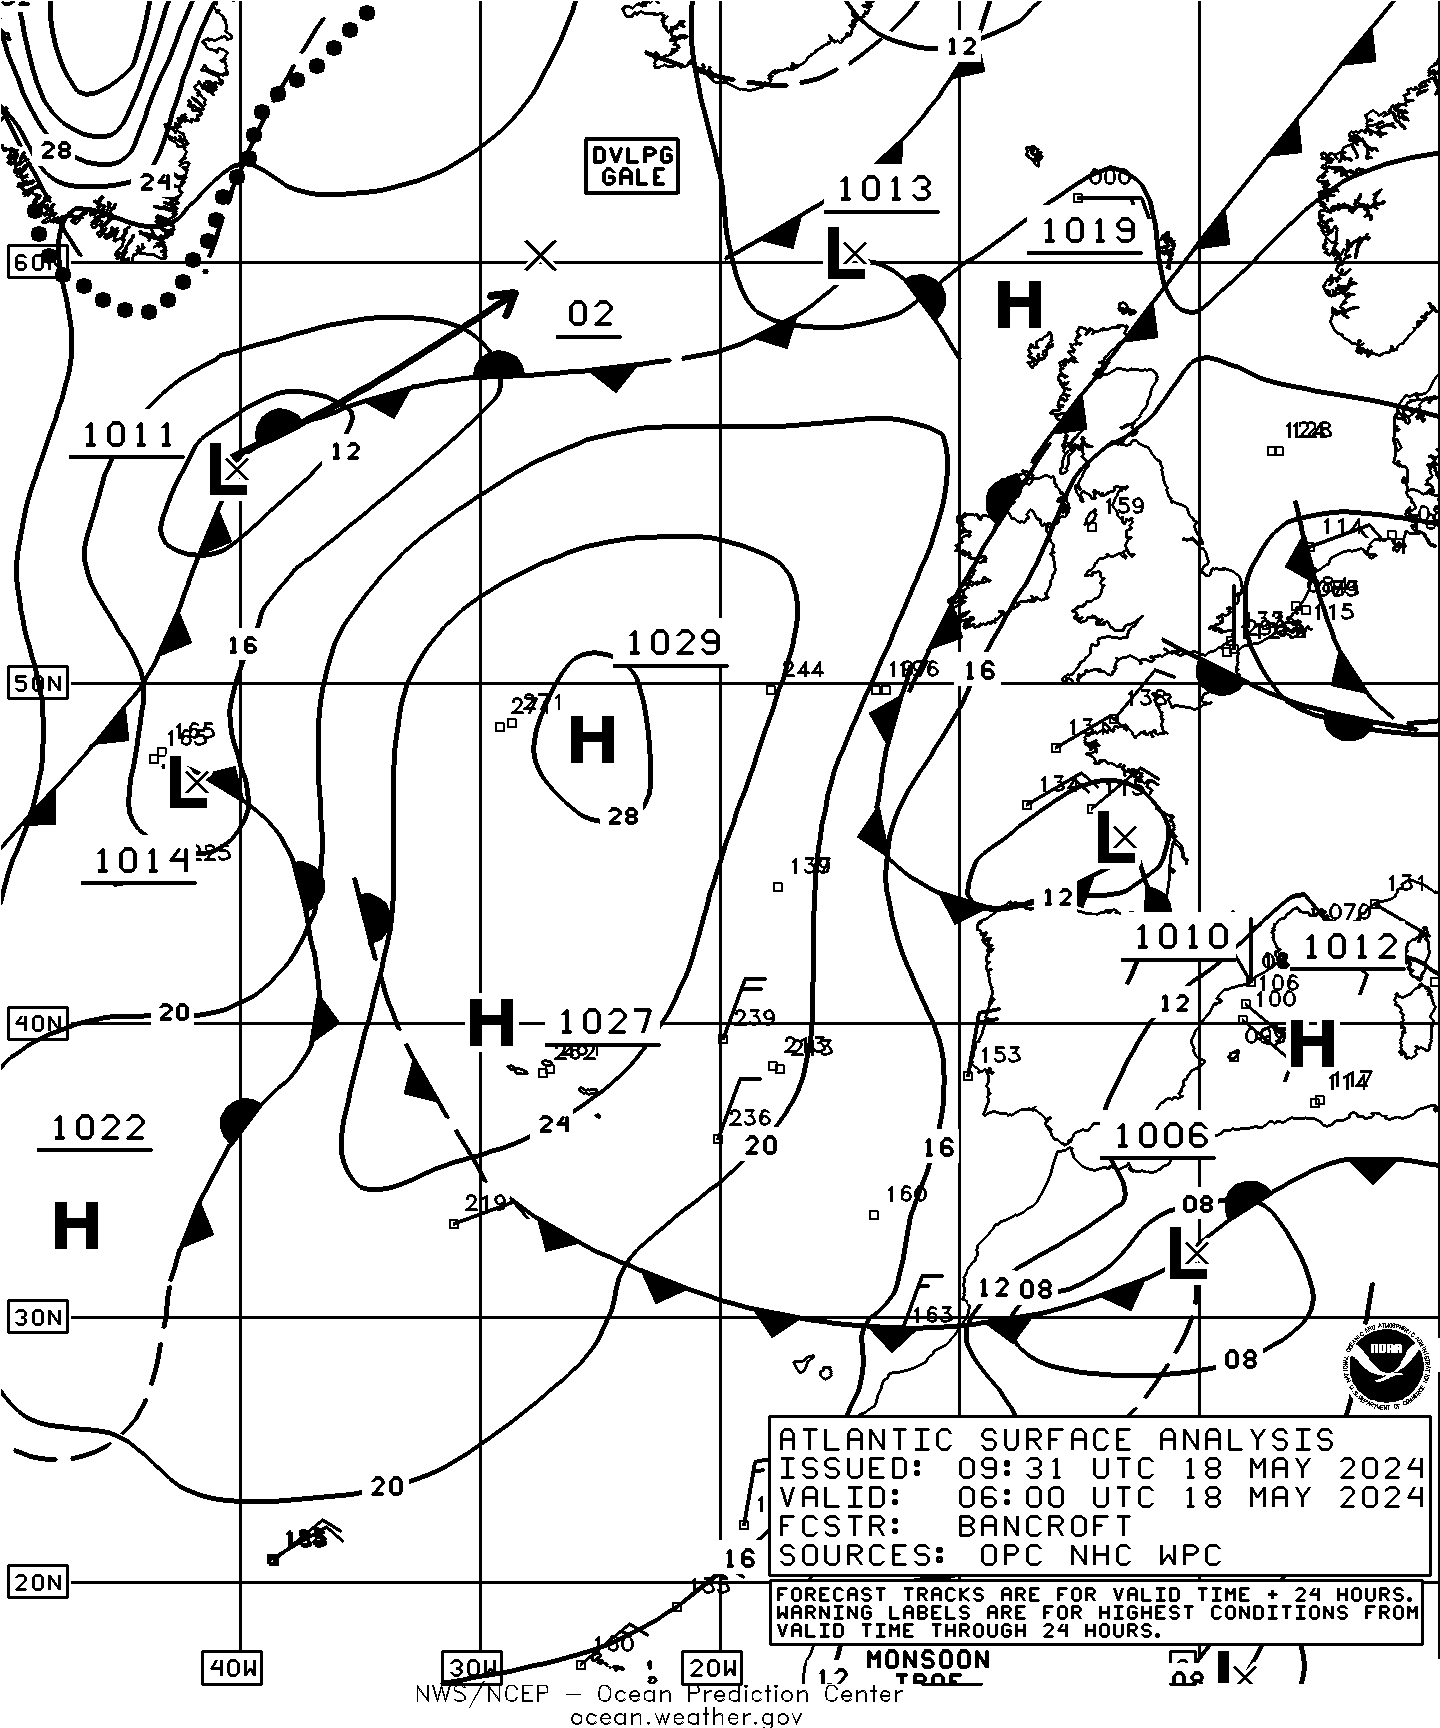
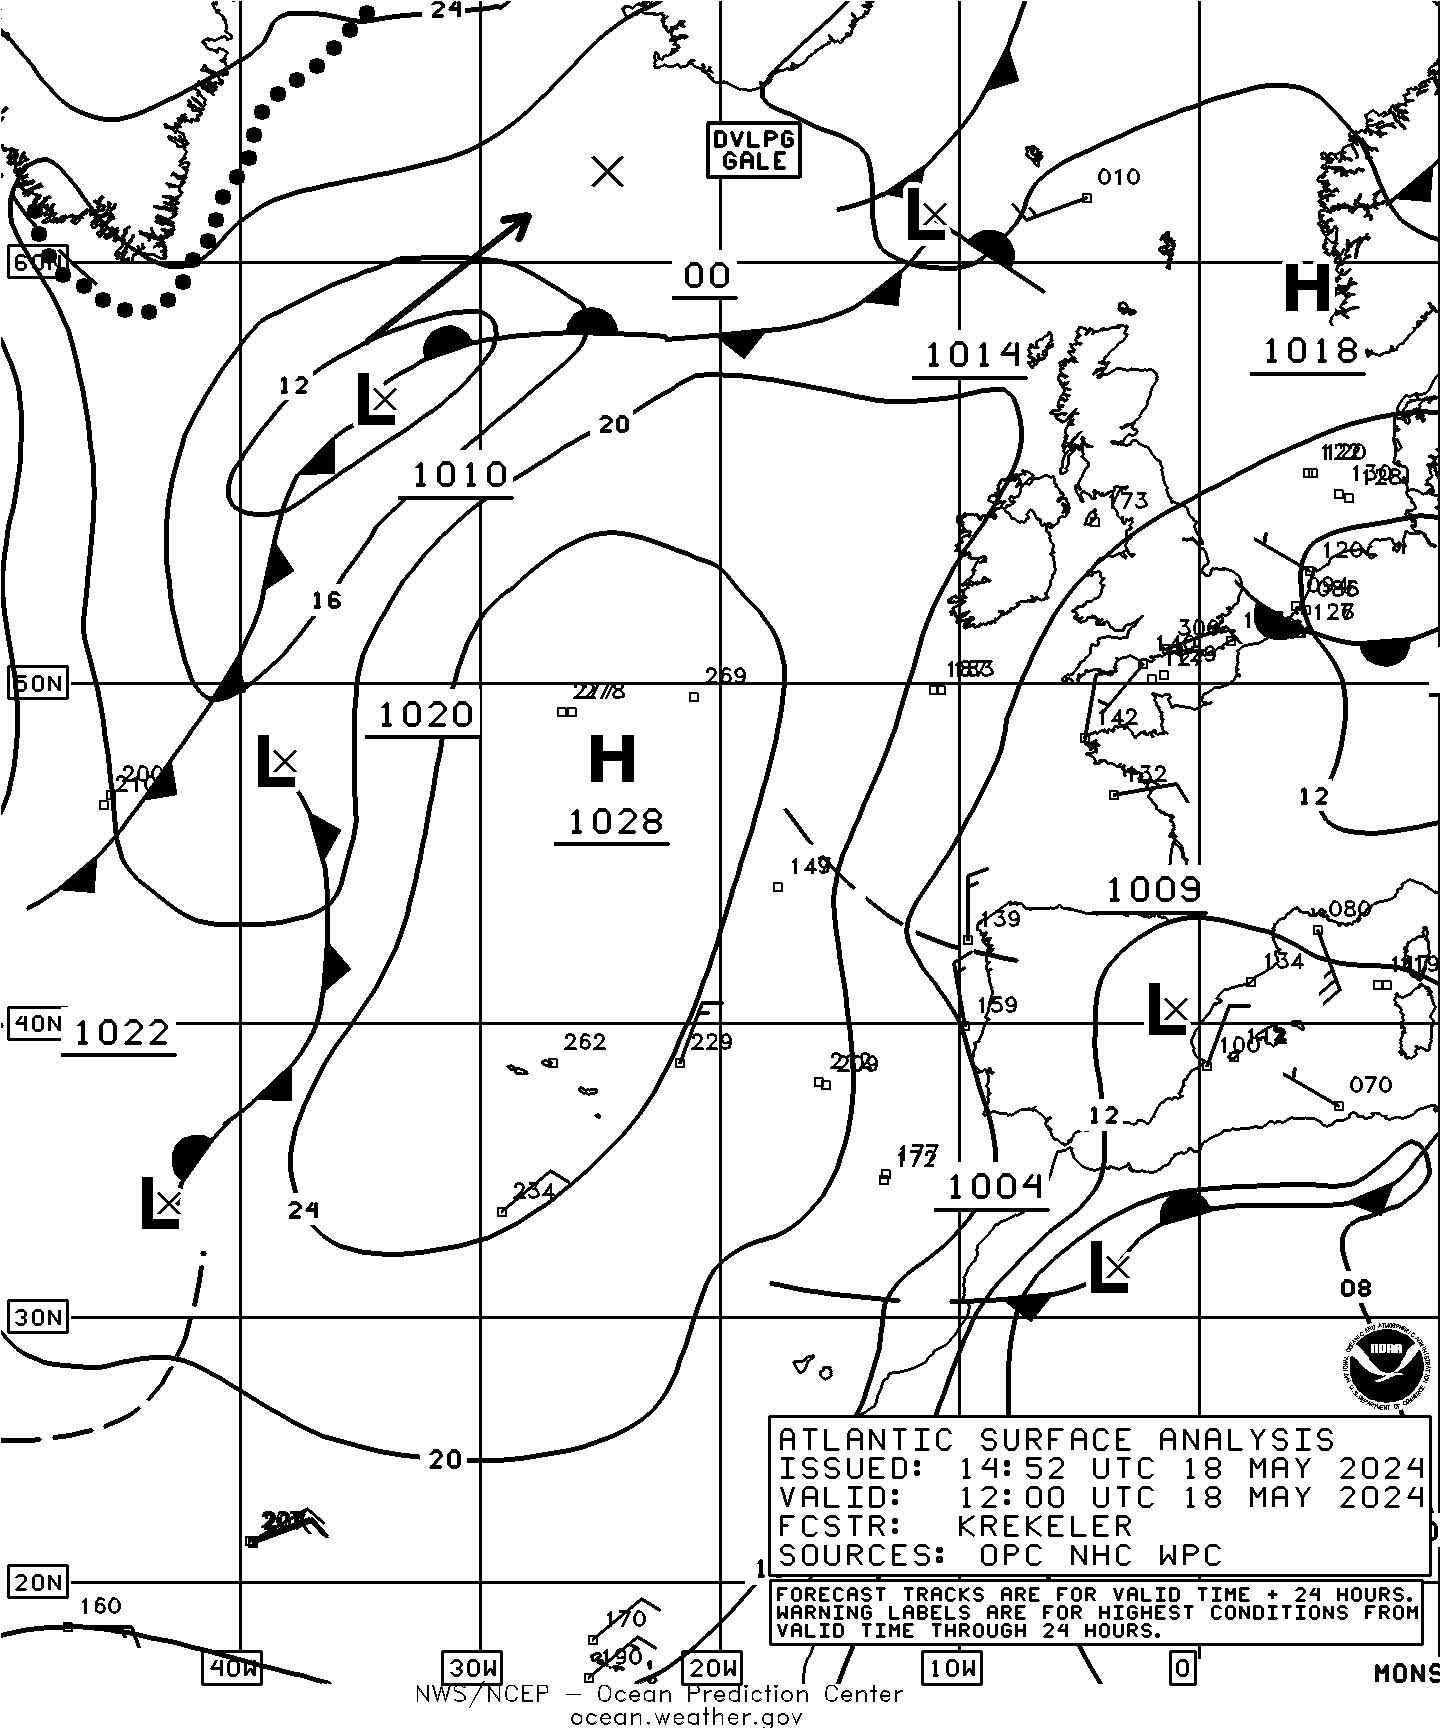
| 0925Z | 06Z Surface Analysis Part 1(15N-65N, 10E-45W) | PYAA03 | TIF|GIF|B/W GIF | 08:56Z Jul 20 2026 |
| 0938Z | 06Z Surface Analysis Part 2 (15N-65N, 40W-95W) | PYAA04 | TIF|GIF|B/W GIF | 08:56Z Jul 20 2026 |
| 0951Z | Satellite Picture (00N-60N, 40W-130W) | EVNT06 | JPG | |
| 1002Z | Retransmit 0925Z: 06Z Surface Analysis Part 1(15N-65N, 10E-45W) | |||
| 1015Z | Retransmit 0938Z: 06Z Surface Analysis Part 2 (15N-65N, 40W-95W) | |||
| 1028Z | Cyclone Danger Area (*see note above) or High Wind&Wave**(5N-40N, 35W-100W) | PWEK90 | TIF|GIF | |
| 1039Z | Retransmit 2239Z: North American Ice Service Chart | PIEA88 | TIF|GIF | |
| 1400Z | Test Pattern | PZZZ94 | ||
| 1405Z | Schedule Part 1 | PLAZ01 | ||
| 1420Z | Schedule Part 2 | PLAZ02 | ||
| 1433Z | Request For Comments | PLAZ03 | ||
| 1443Z | Product Notice Bulletin | PLAZ04 | ||
| 1453Z | 12Z Preliminary Surface Analysis (28N-52N, 45W-85W) | PYAC01 | TIF|GIF | |
| 1503Z | Satellite Picture (20N-55N, 55W-95W) | EVNT12 | JPG | |
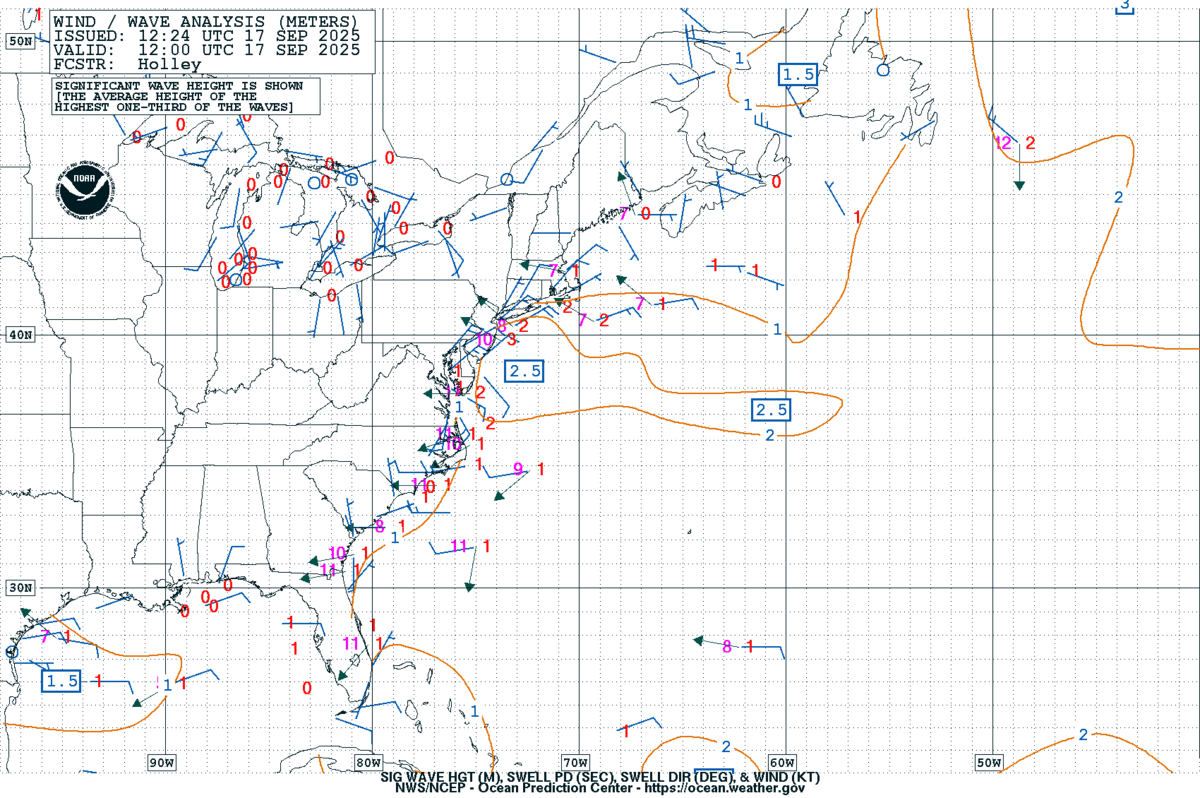
| 1515Z | 12Z Wind&Wave Analysis (22N-51N, 40W-98W) | PWAA89 | TIF|GIF|B/W GIF | 12:59Z Jul 19 2026 |
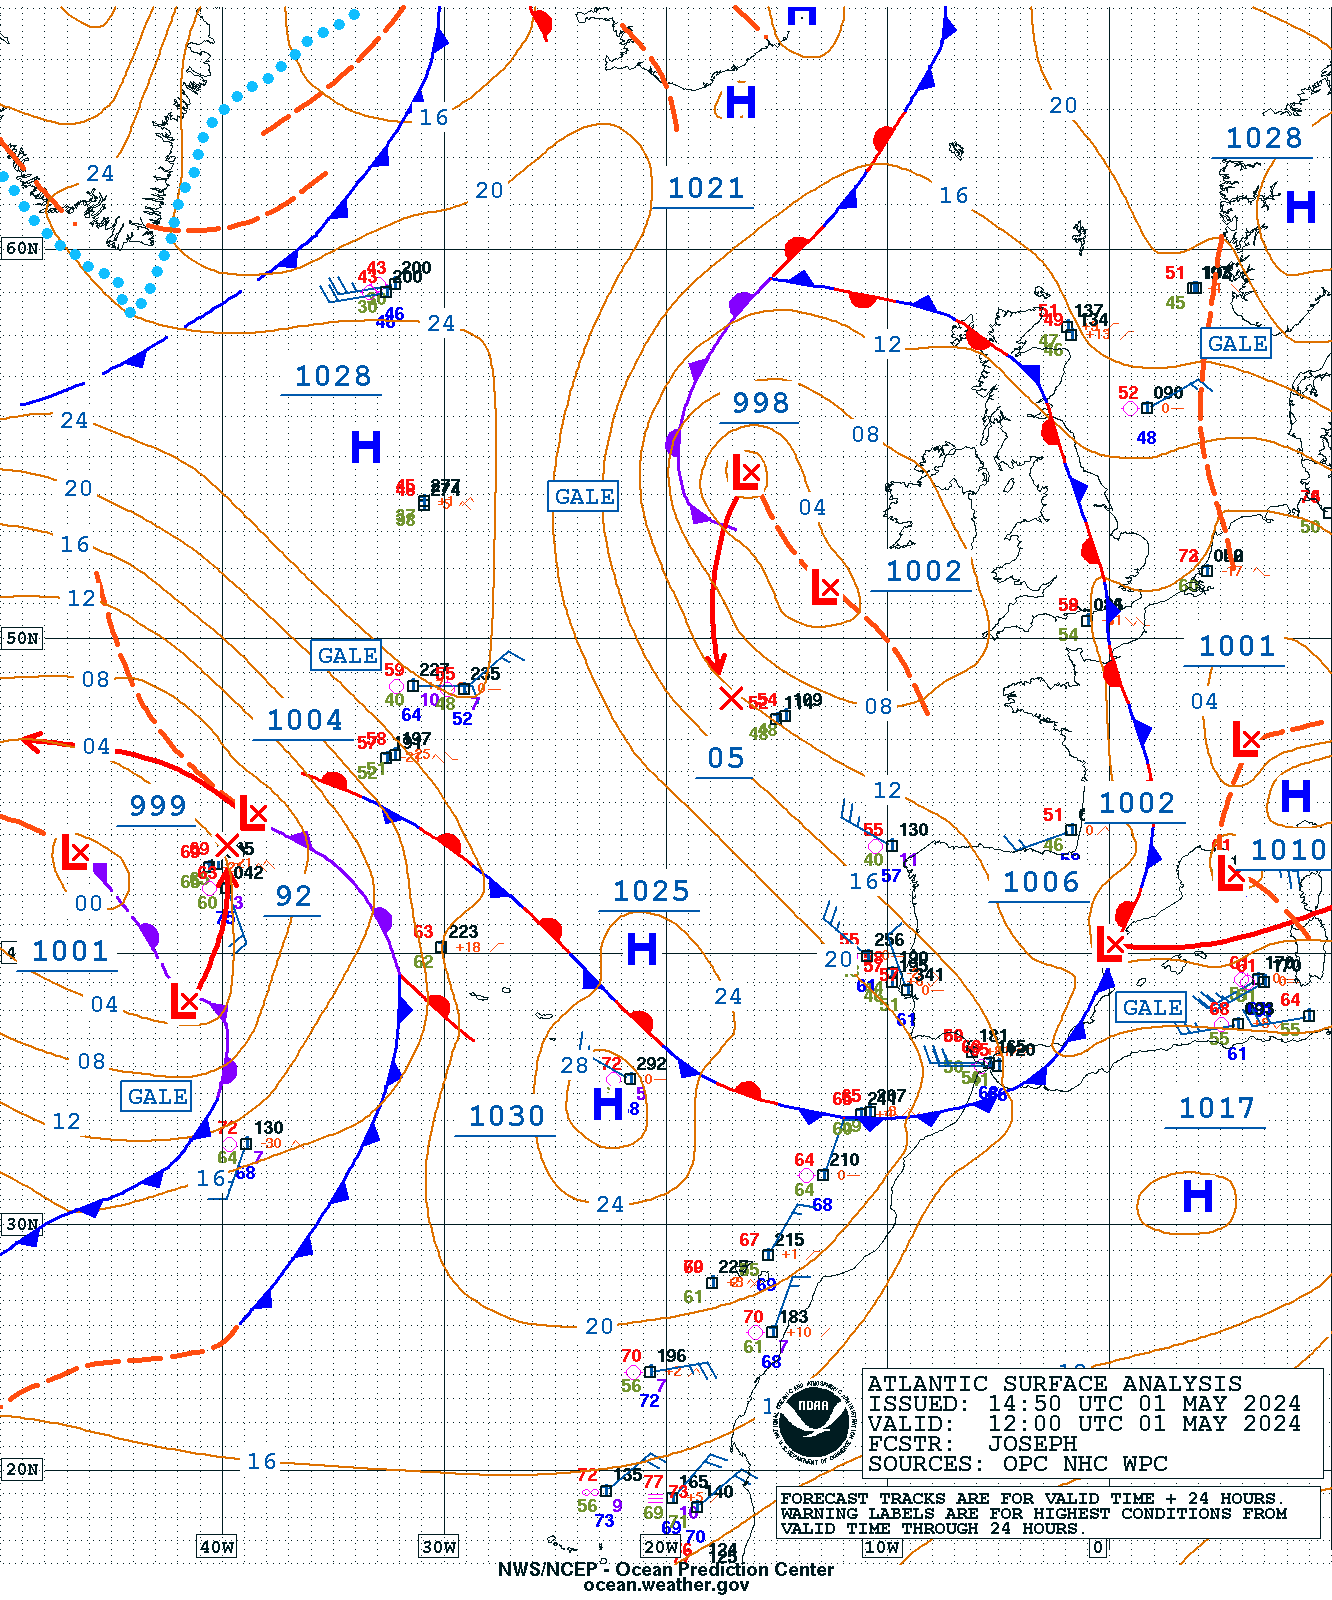
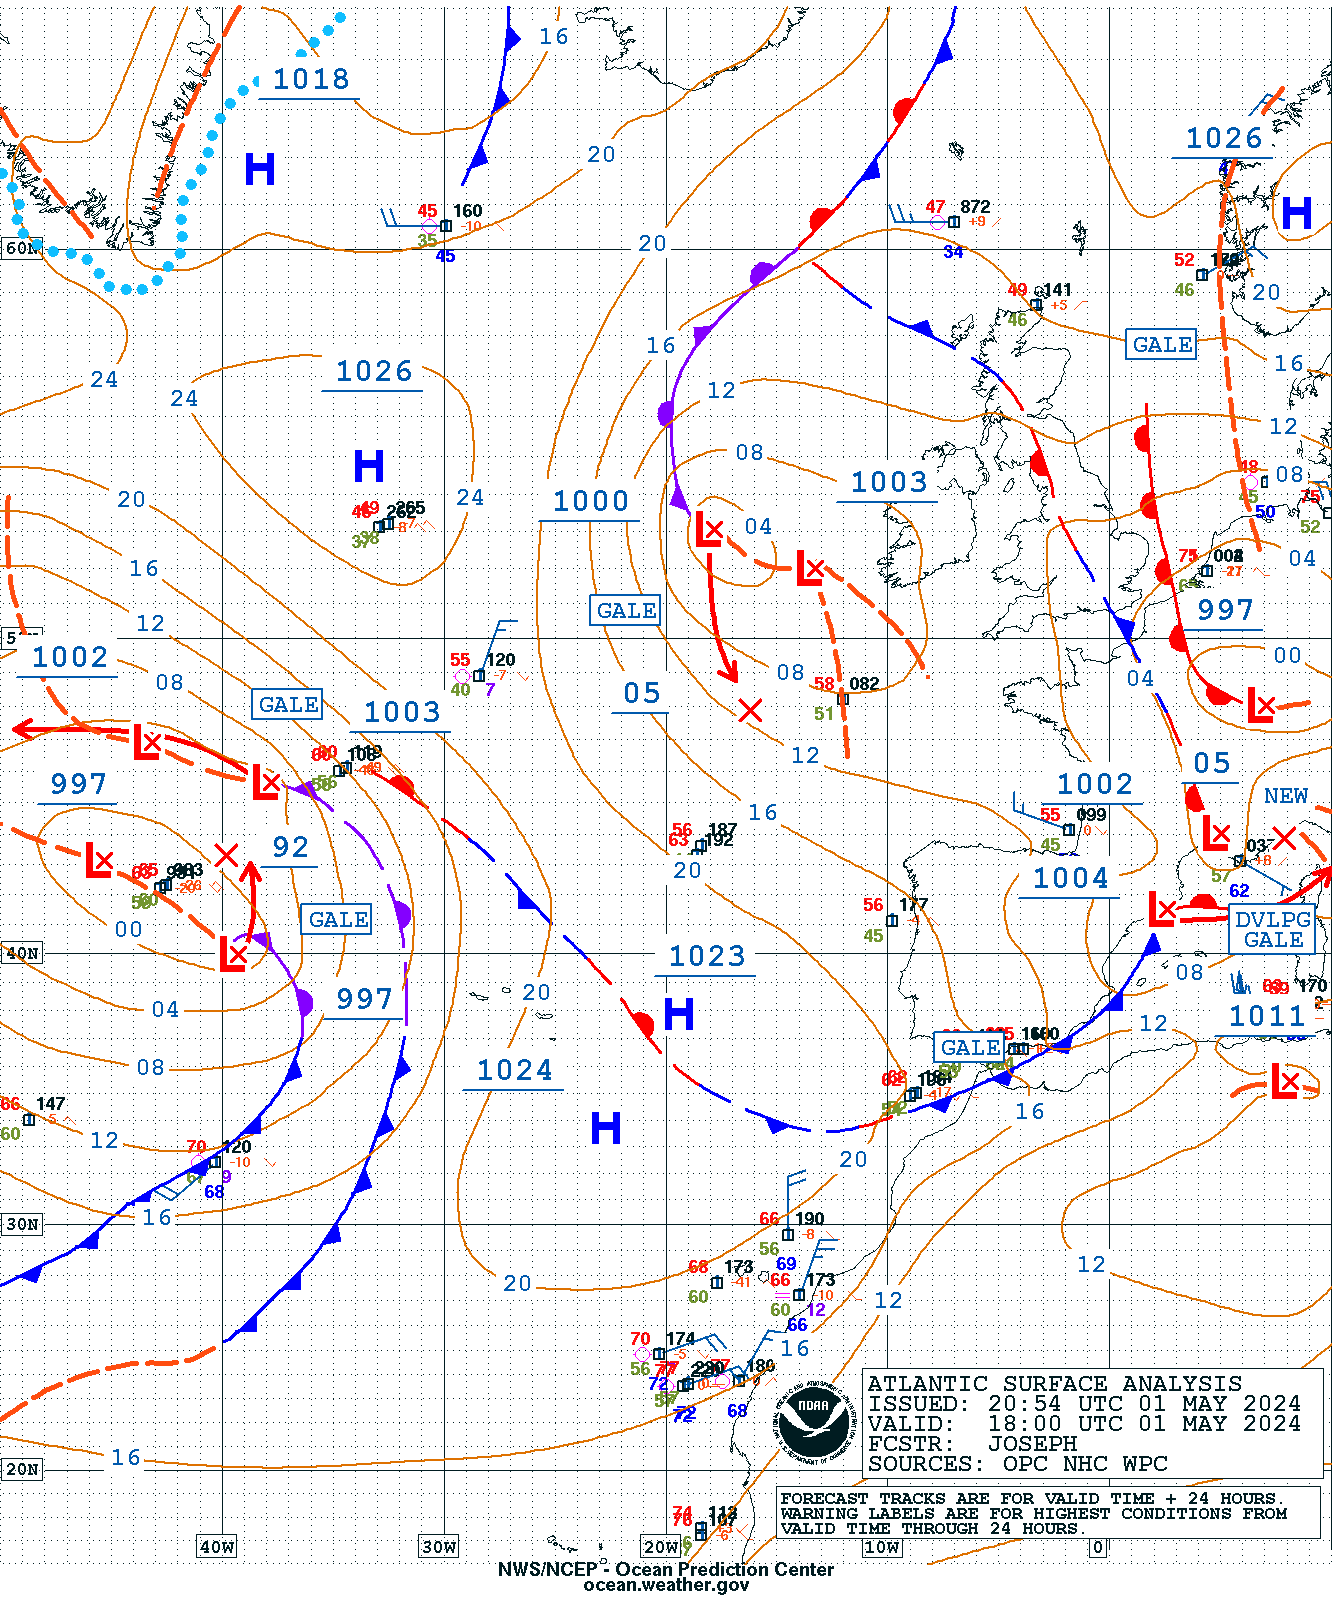
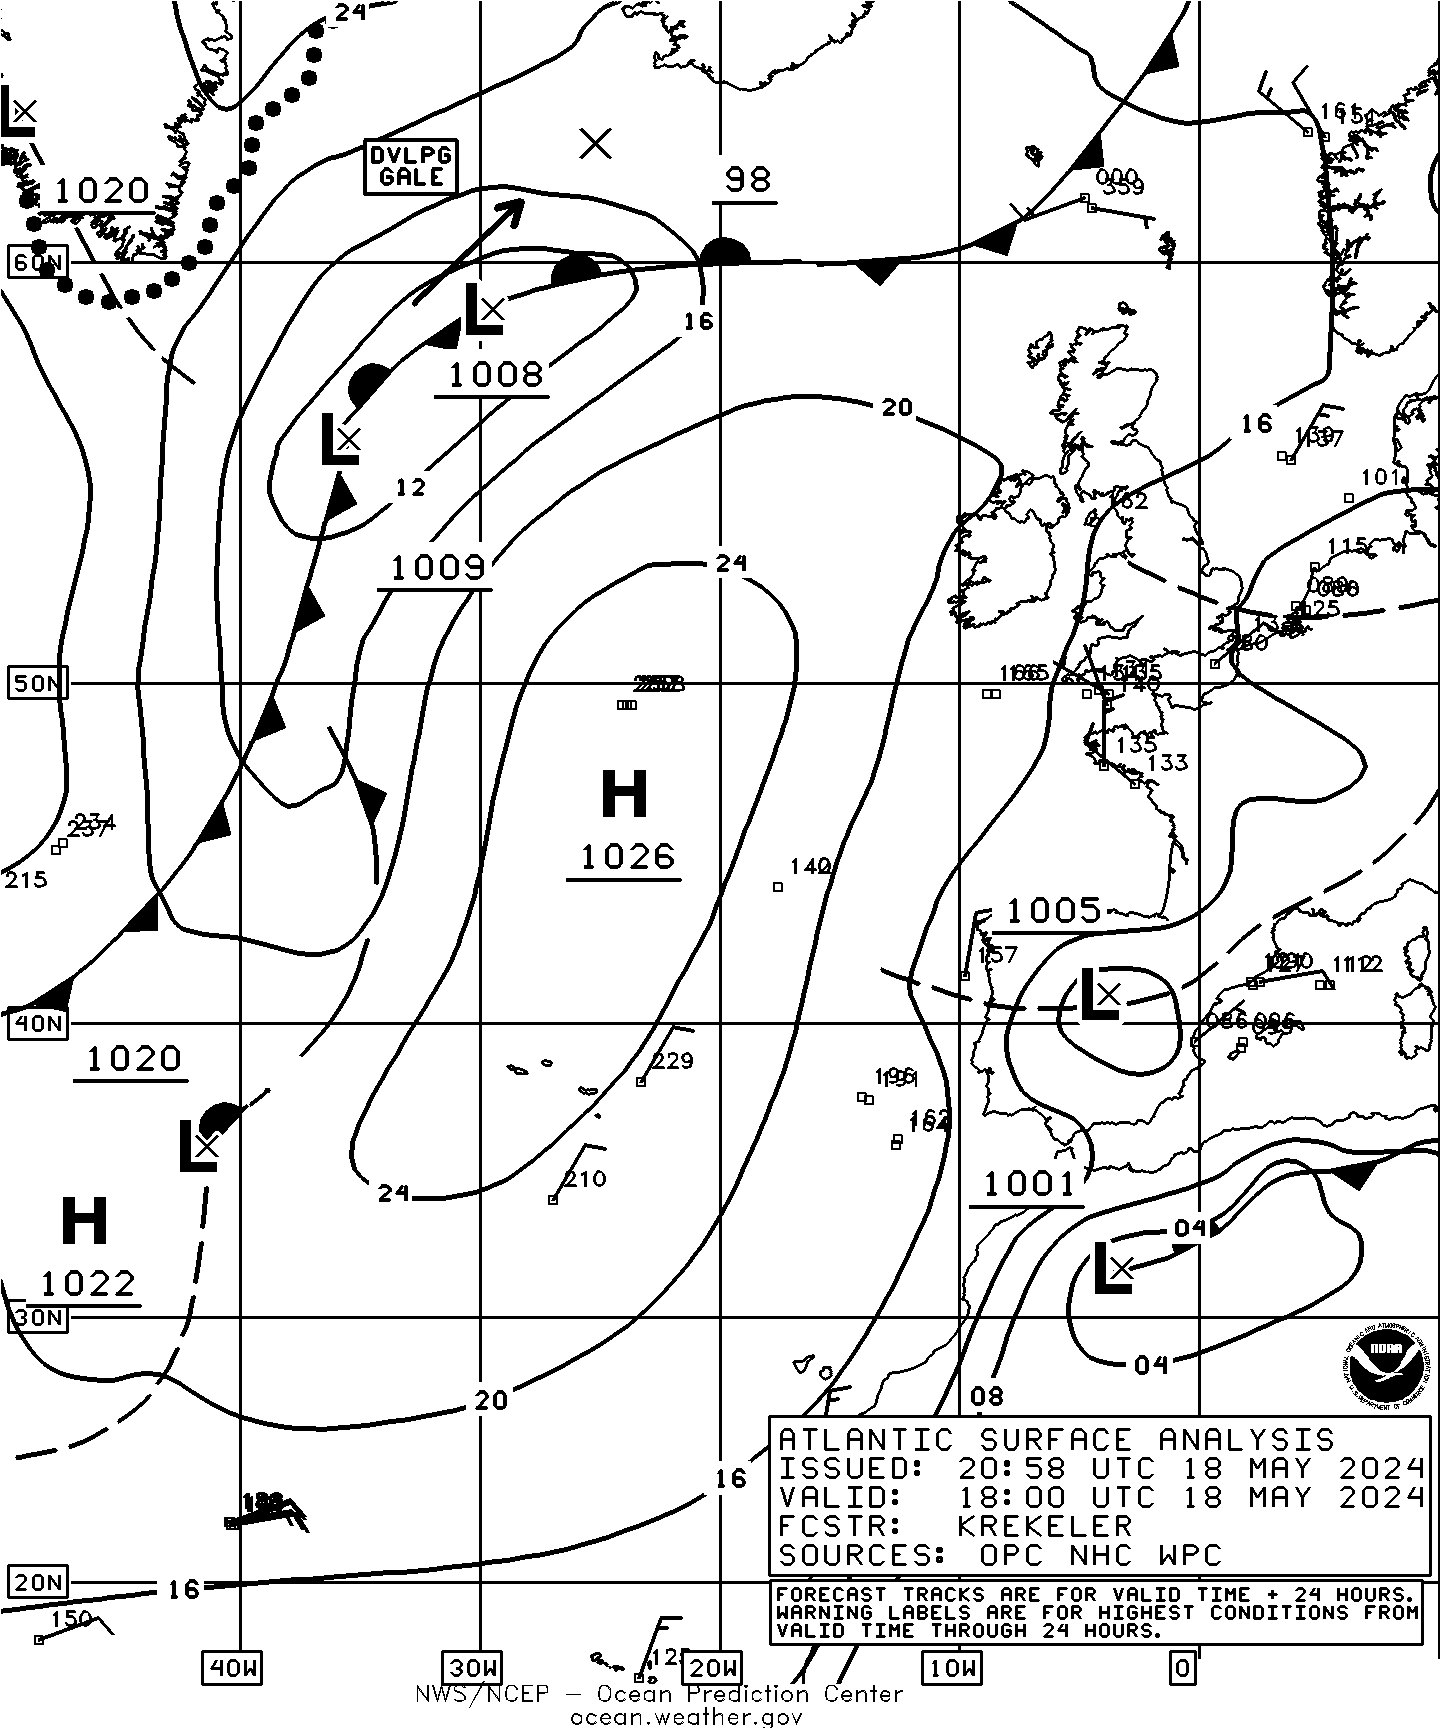
| 1525Z | 12Z Surface Analysis Part 1 (15N-65N, 10E-45W) | PYAA05 | TIF|GIF|B/W GIF | 14:53Z Jul 19 2026 |
| 1538Z | 12Z Surface Analysis Part 2 (15N-65N, 40W-95W) | PYAA06 | TIF|GIF|B/W GIF | 14:53Z Jul 19 2026 |
| 1600Z | North American Ice Service Chart | PIEA88 | TIF|GIF | |
| 1720Z | Test Pattern | PZZZ94 | ||
| 1723Z | Retransmit 1525Z: 12Z Surface Analysis Part 1 (15N-65N, 10E-45W) | |||
| 1736Z | Retransmit 1538Z: 12Z Surface Analysis Part 2 (15N-65N, 40W-95W) | |||
| 1749Z | 12Z 500mb Analysis (15N-65N, 10E-95W) | PPAA51 | TIF|GIF|B/W GIF | 17:19Z Jul 19 2026 |
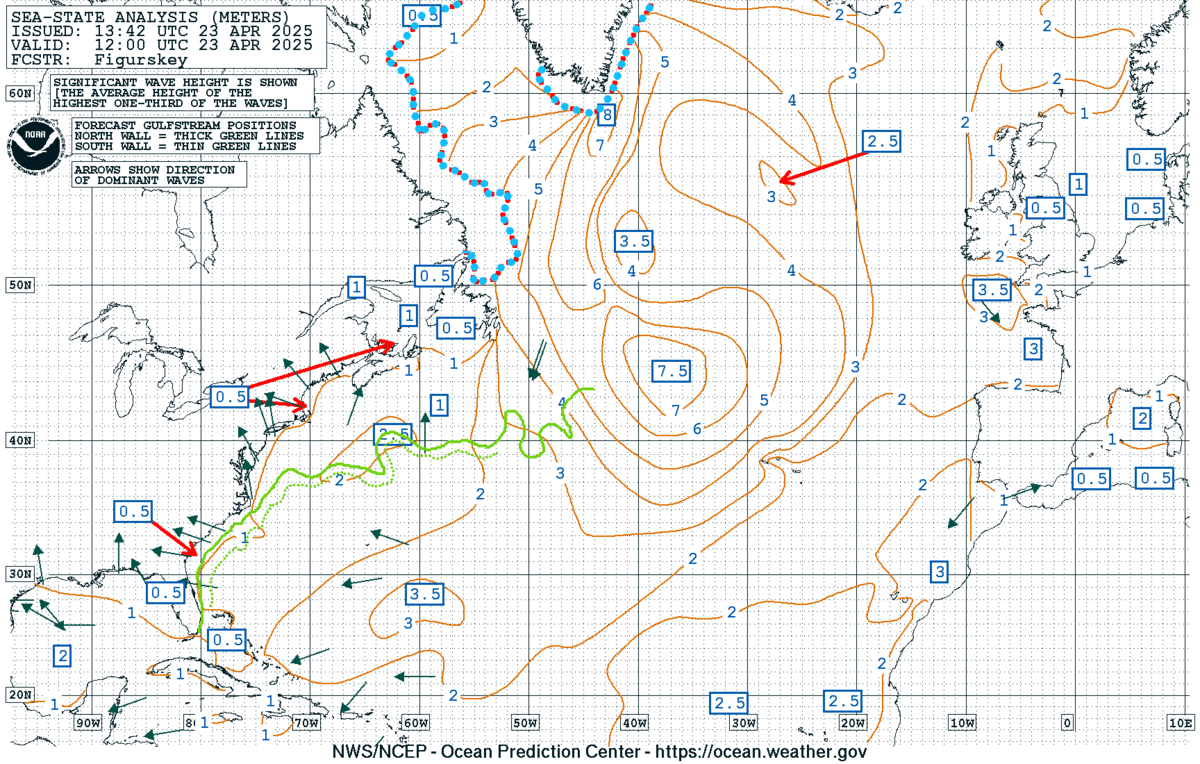
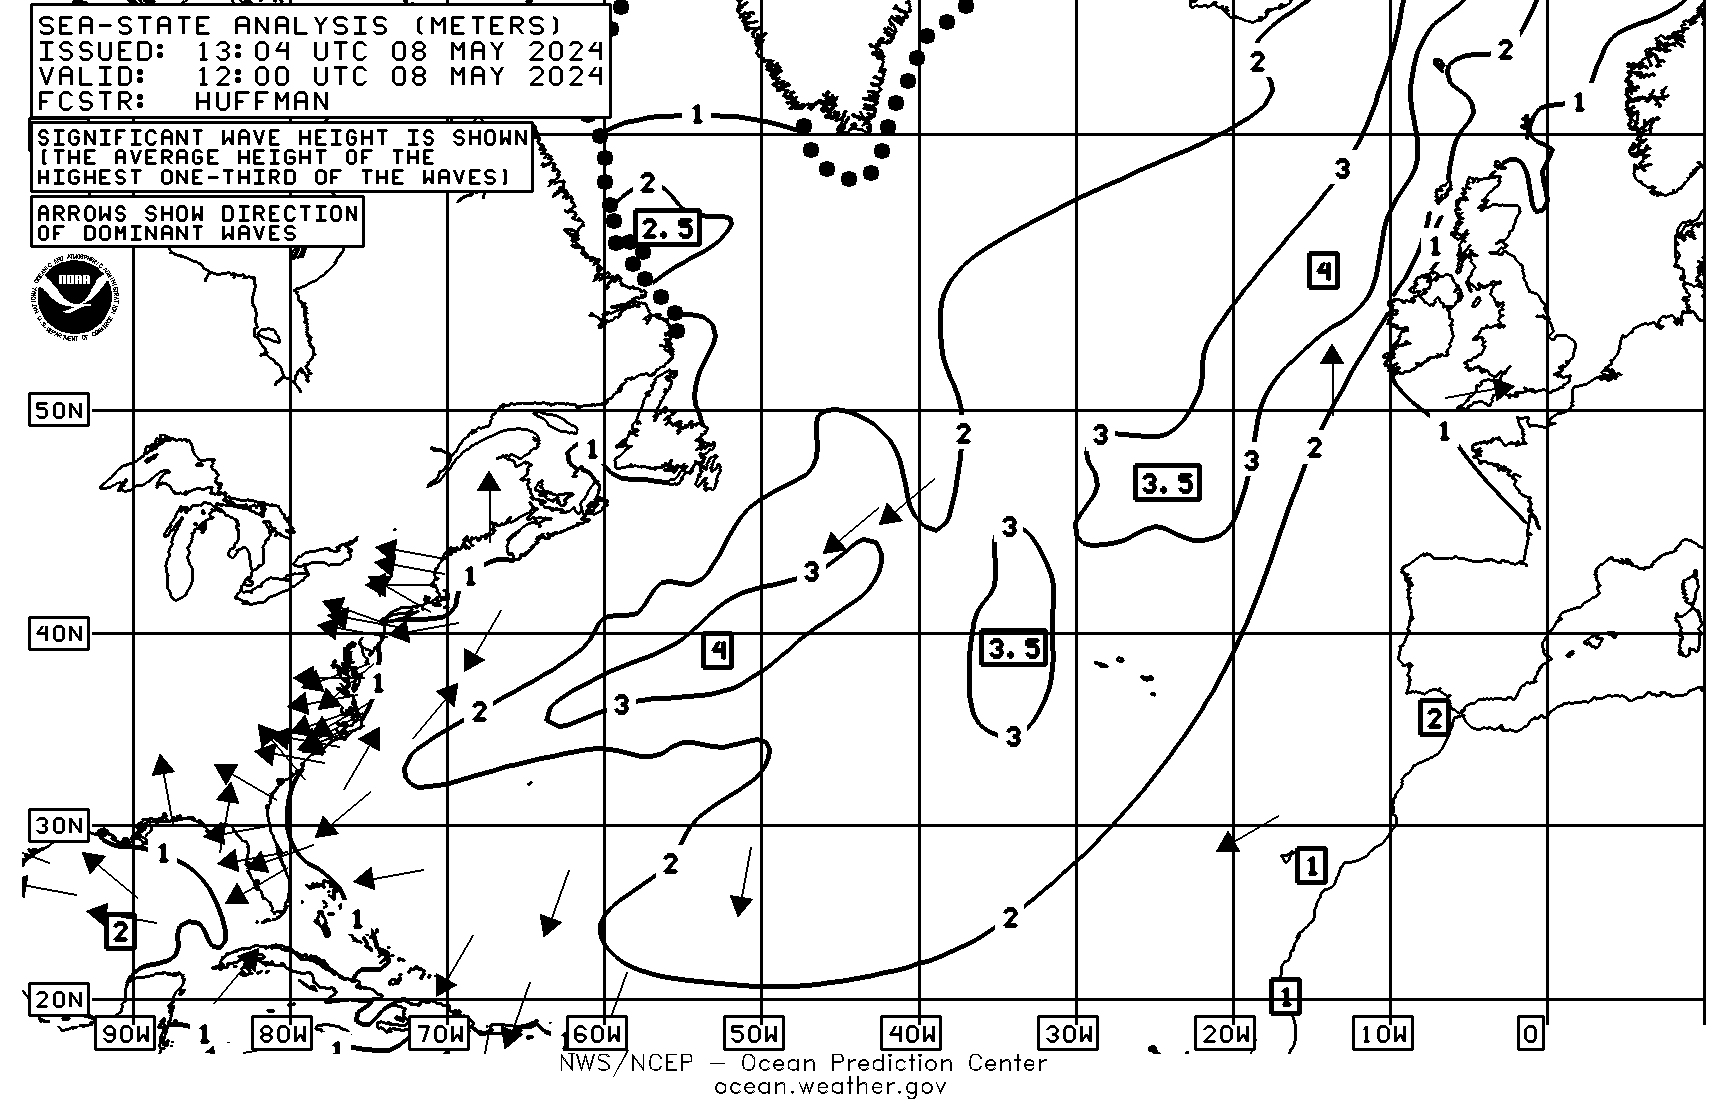
| 1759Z | 12Z Sea State Analysis (15N-65N, 10E-95W) | PJAA99 | TIF|GIF|B/W GIF | 12:45Z Jul 19 2026 |
| 1810Z | 24Hr Surface/Ice Accretion VT 12Z (15N-65N, 10E-95W) | PPAE01 | TIF|GIF|B/W GIF | 16:20Z Jul 19 2026 |
| 1824Z | Cyclone Danger Area (*see note above) or High Wind&Wave** (5N-40N, 35W-100W) | PWEK91 | TIF|GIF | |
| 1835Z | 24Hr Wind&Wave VT 12Z (15N-65N, 10E-95W) | PWAE99 | TIF|GIF|B/W GIF | 18:56Z Jul 19 2026 |
| 1855Z | 24Hr 500mb VT 12Z (15N-65N, 10E-95W) | PPAE51 | TIF|GIF|B/W GIF | 17:20Z Jul 19 2026 |
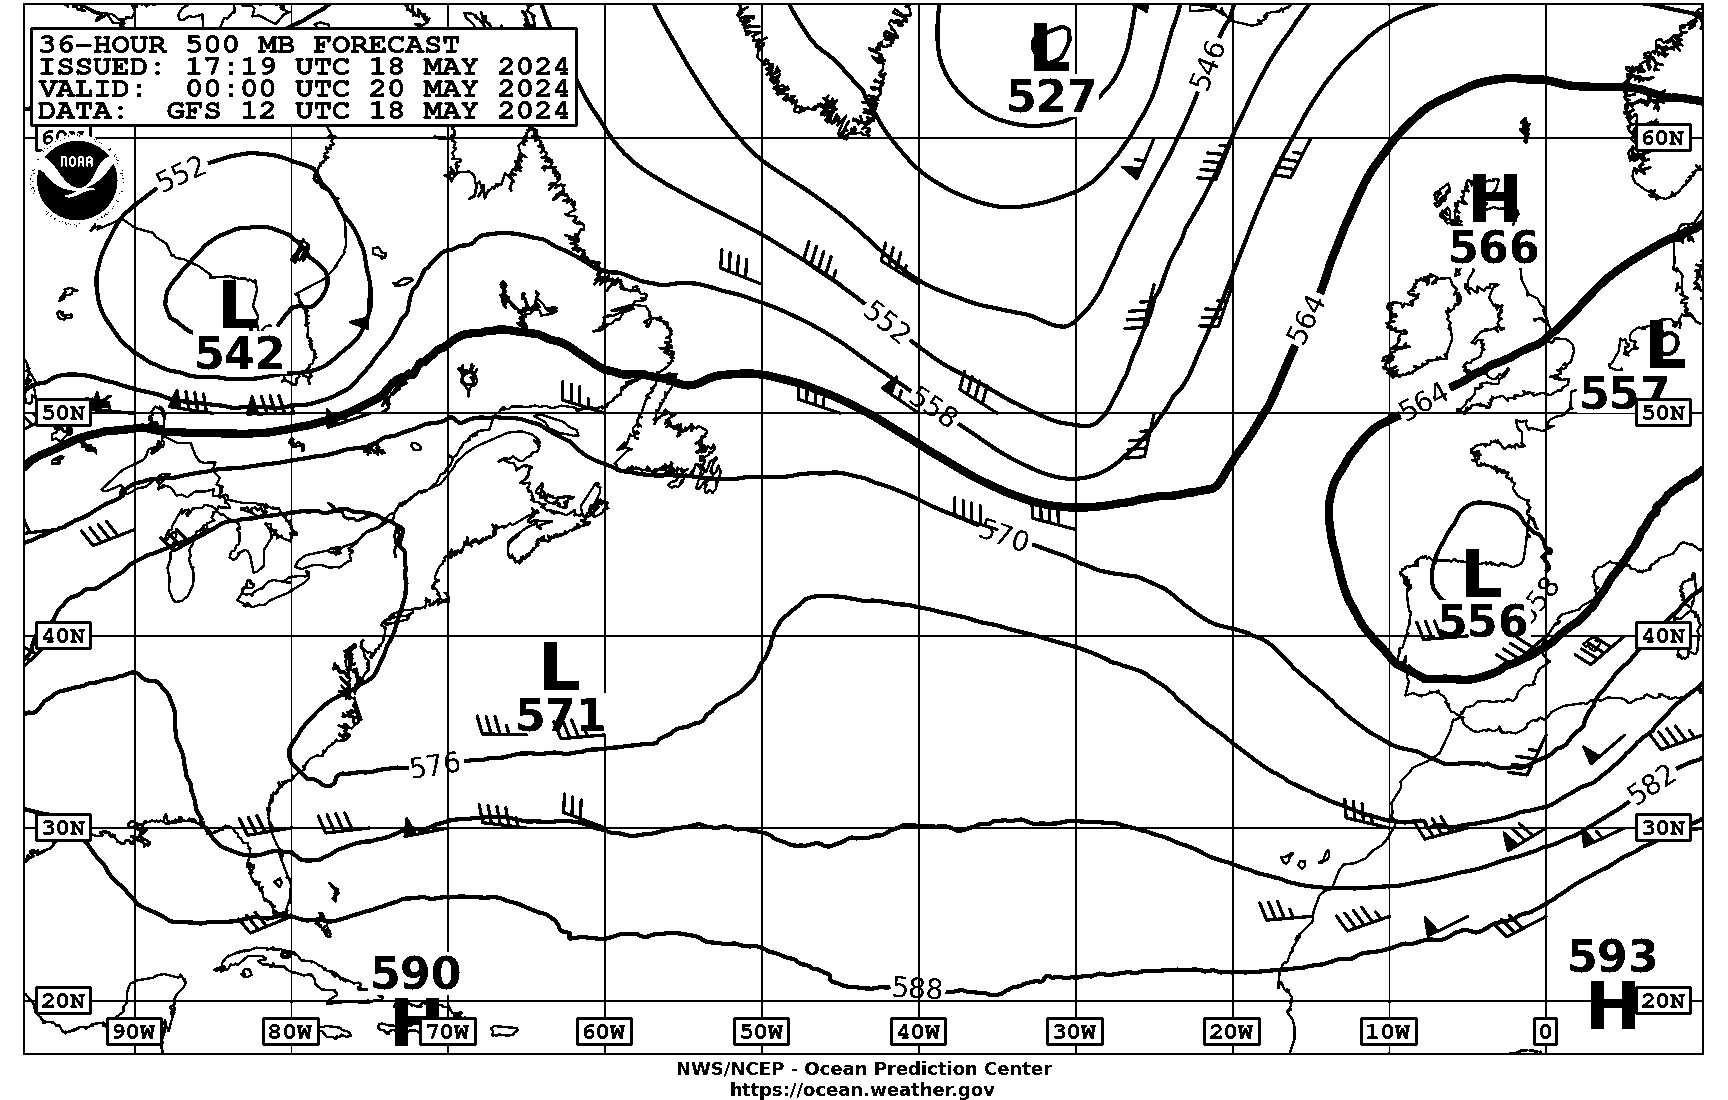
| 1905Z | 36Hr 500mb VT 12Z (15N-65N, 10E-95W) | PPAG51 | TIF|GIF|B/W GIF | 17:20Z Jul 19 2026 |
| 1915Z | 96Hr Surface/Ice Accretion VT 12Z (15N-65N, 10E-95W) | PWAM99 | TIF|GIF|B/W GIF | 14:33Z Jun 01 2026 |
| 1925Z | 96Hr Wind&Wave VT 12Z (15N-65N, 10E-95W) | PJAM98 | TIF|GIF|B/W GIF | 17:23Z Jul 19 2026 |
| 1935Z | 96Hr 500mb VT 12Z (15N-65N, 10E-95W) | PPAM50 | TIF|GIF|B/W GIF | 17:21Z Jul 19 2026 |
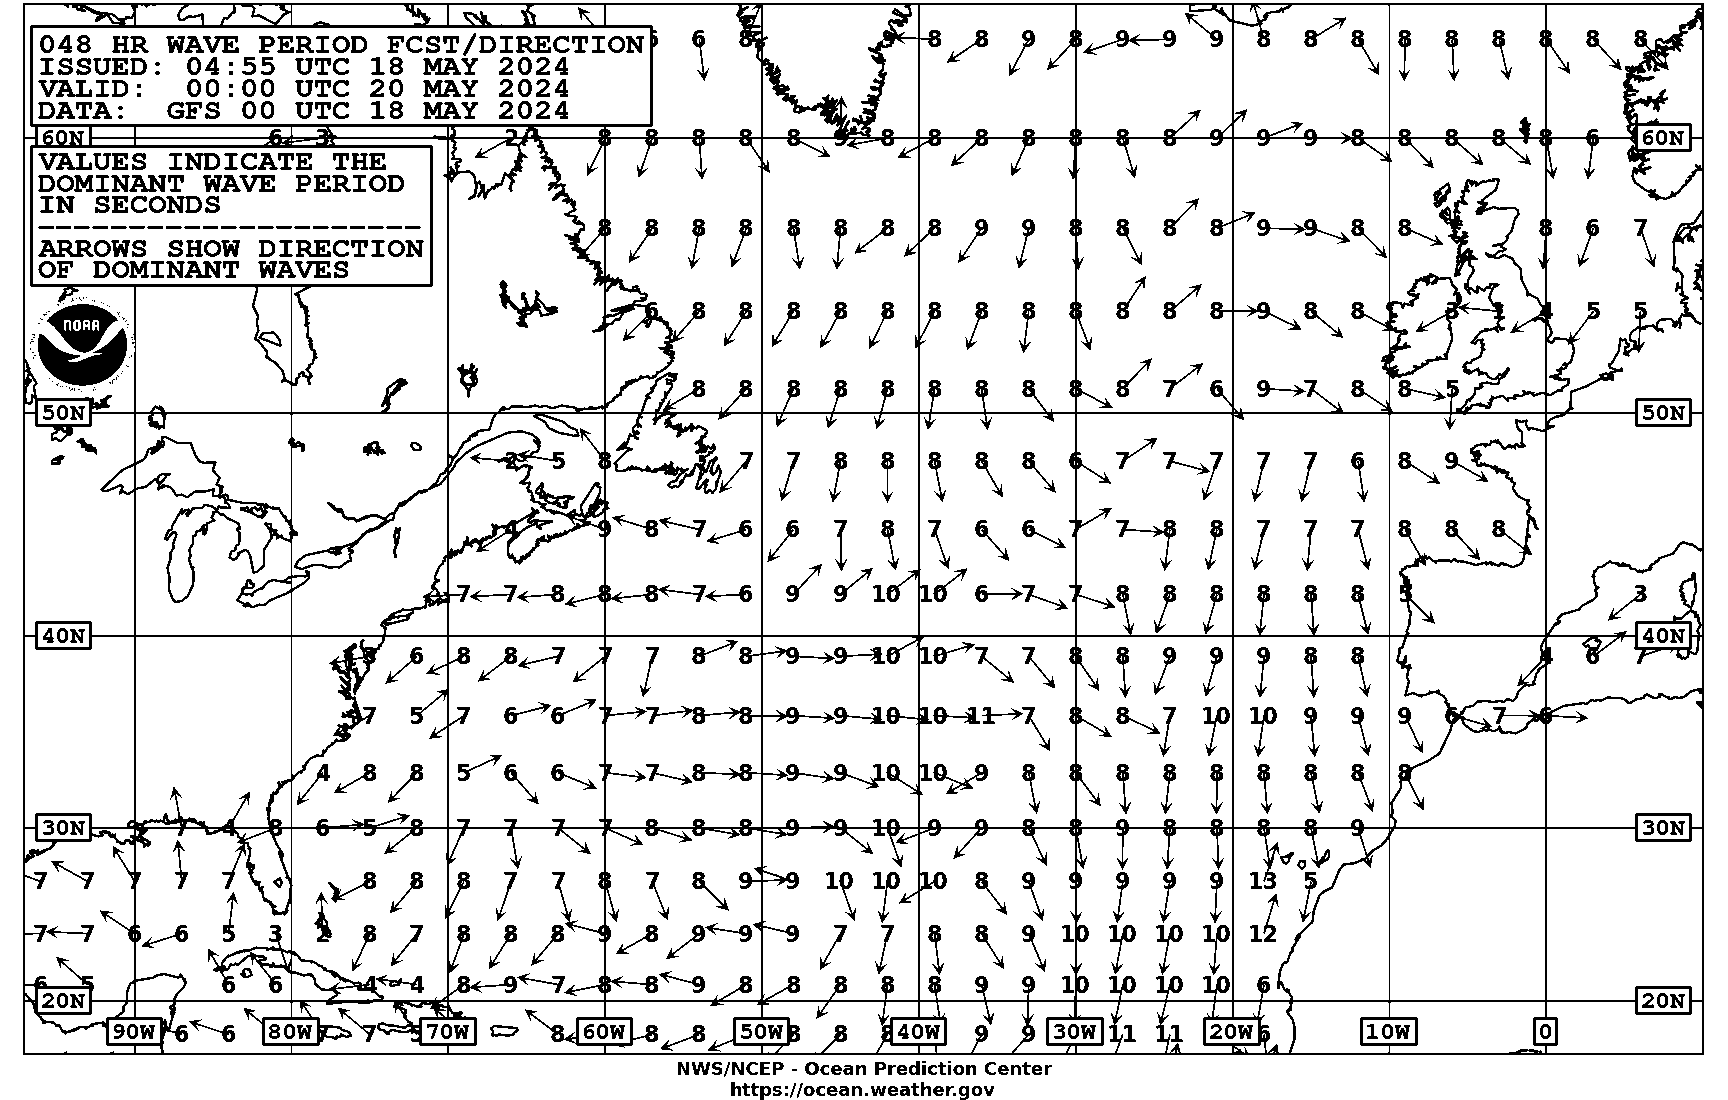
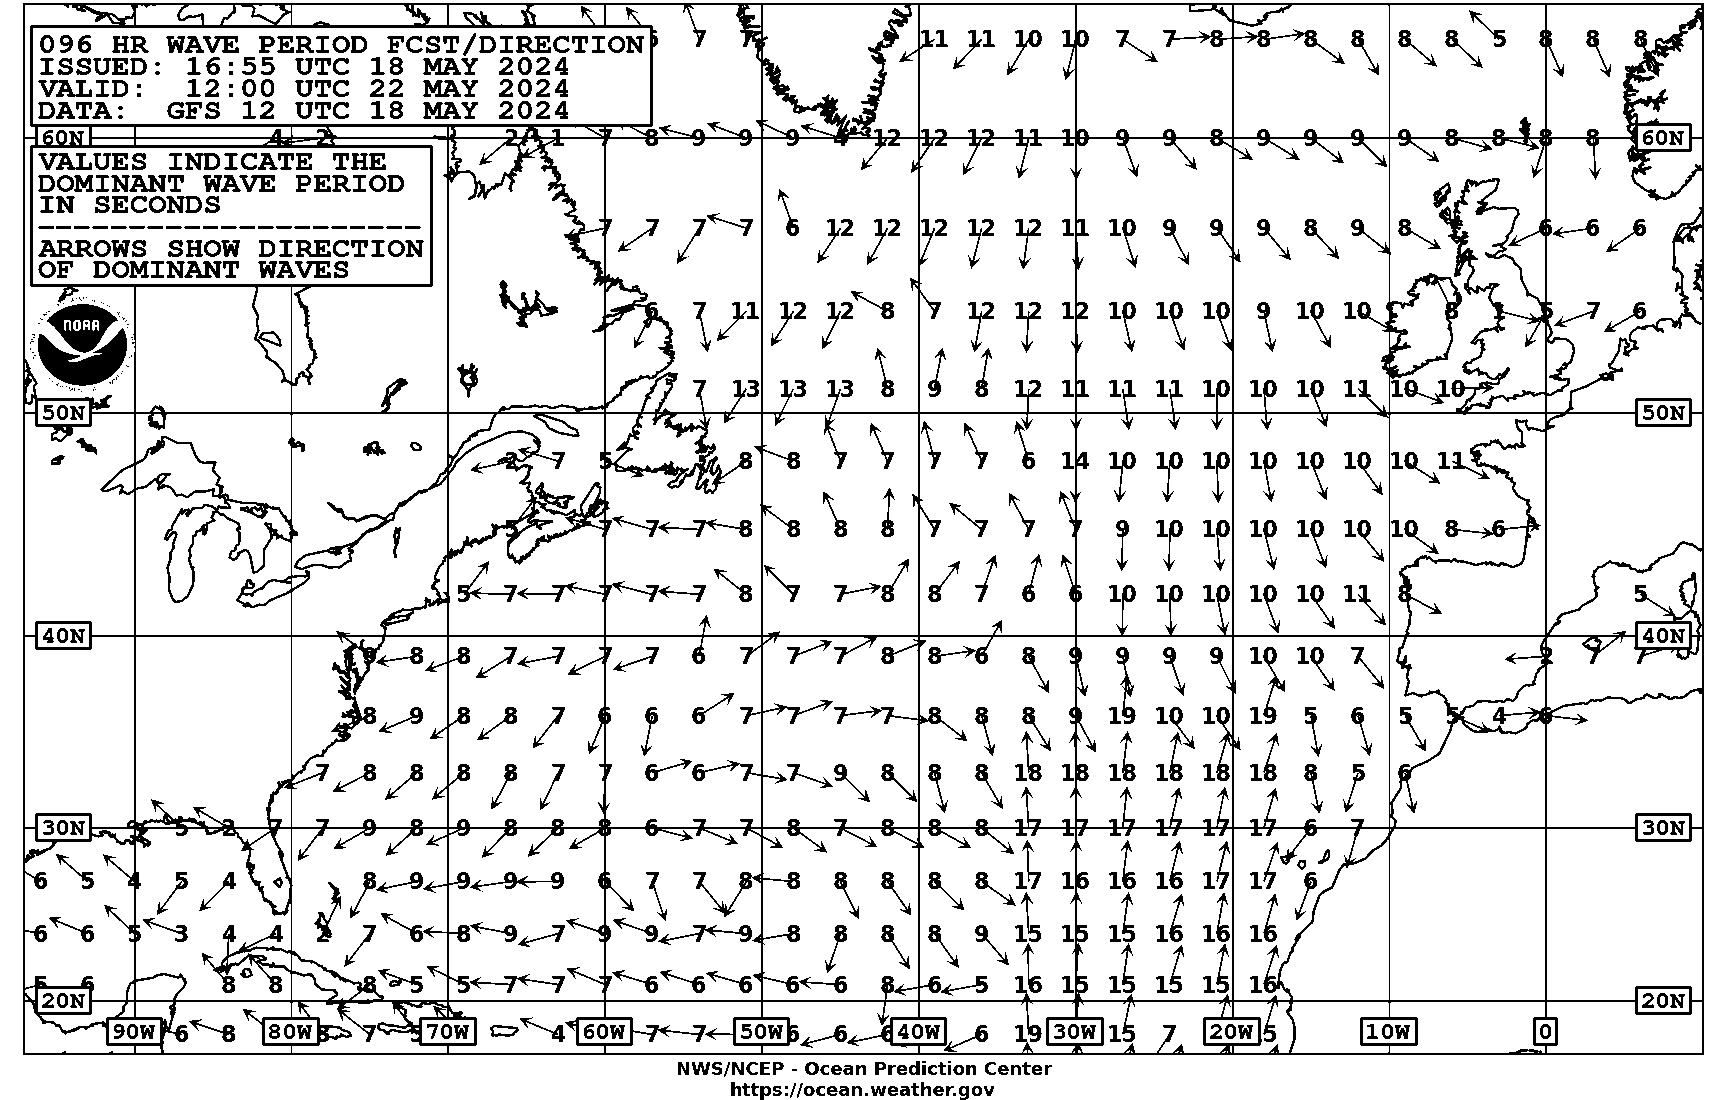
| 1945Z | 96Hr Peak Wave Period & Direction VT 12Z (15N-65N, 10E-95W) | PJAM88 | TIF|GIF|B/W GIF | 16:58Z Jul 19 2026 |
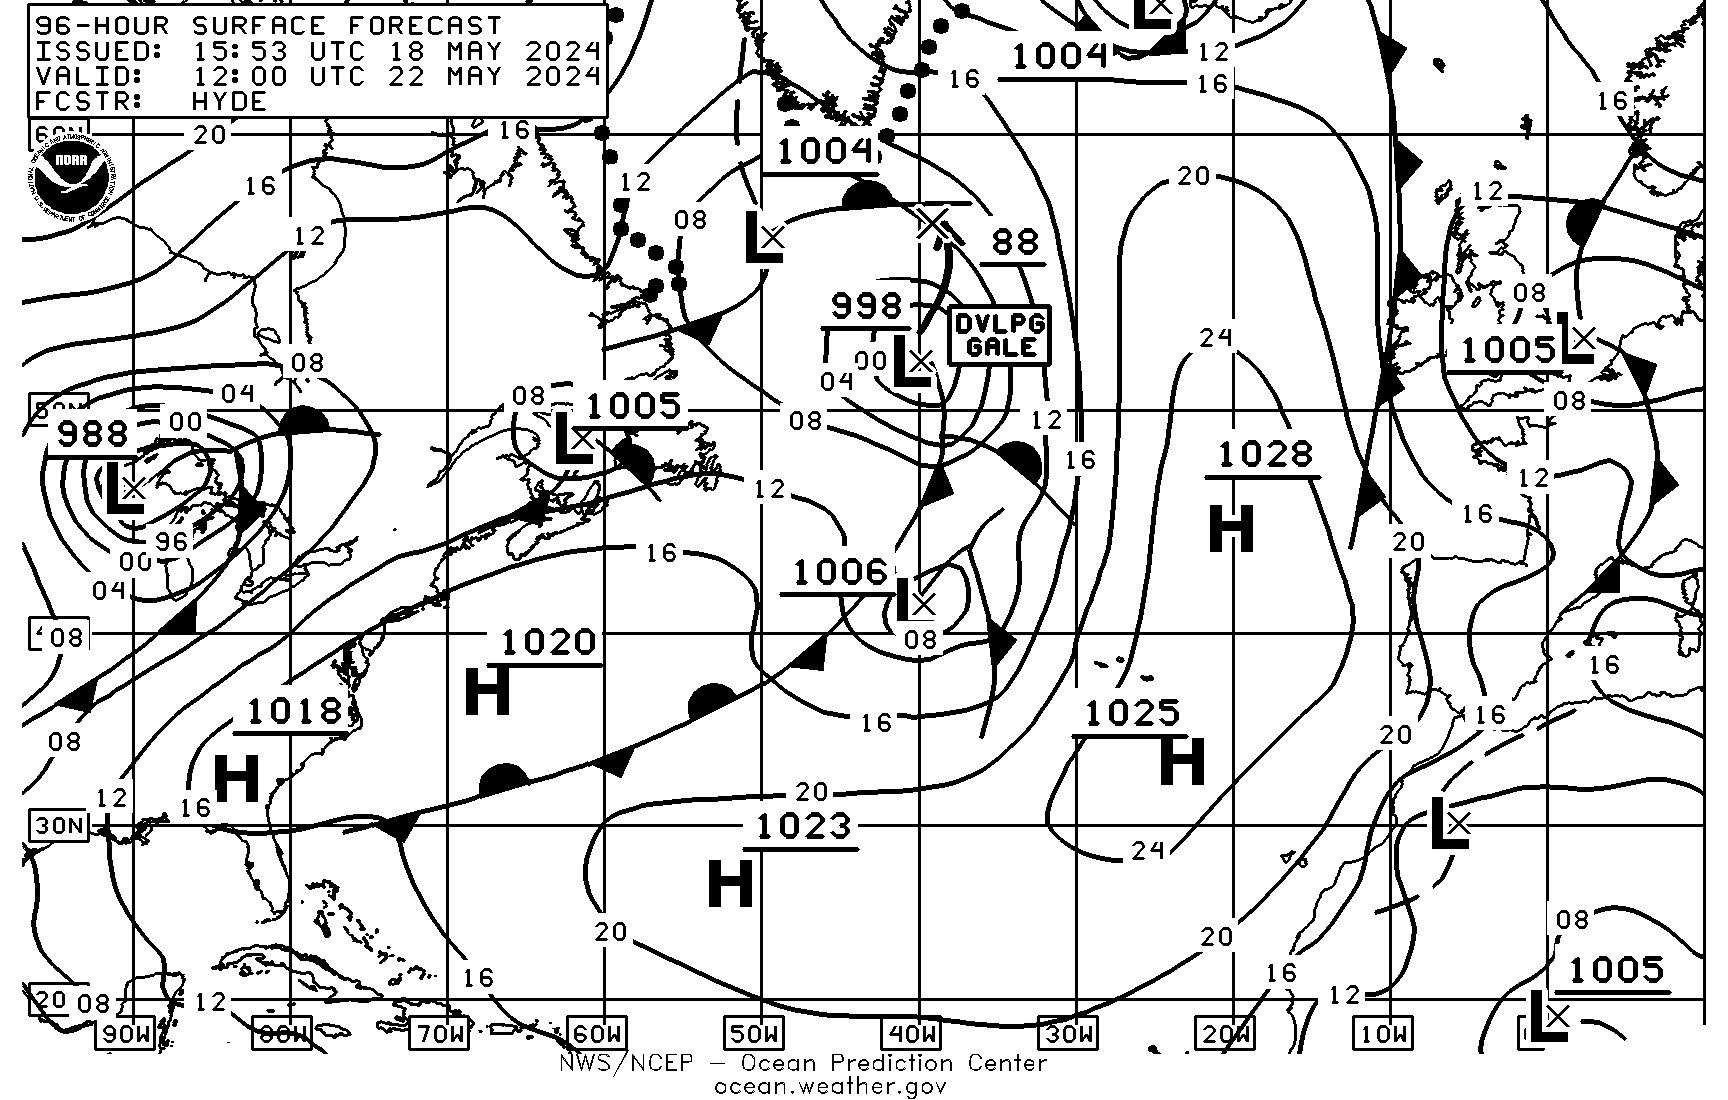
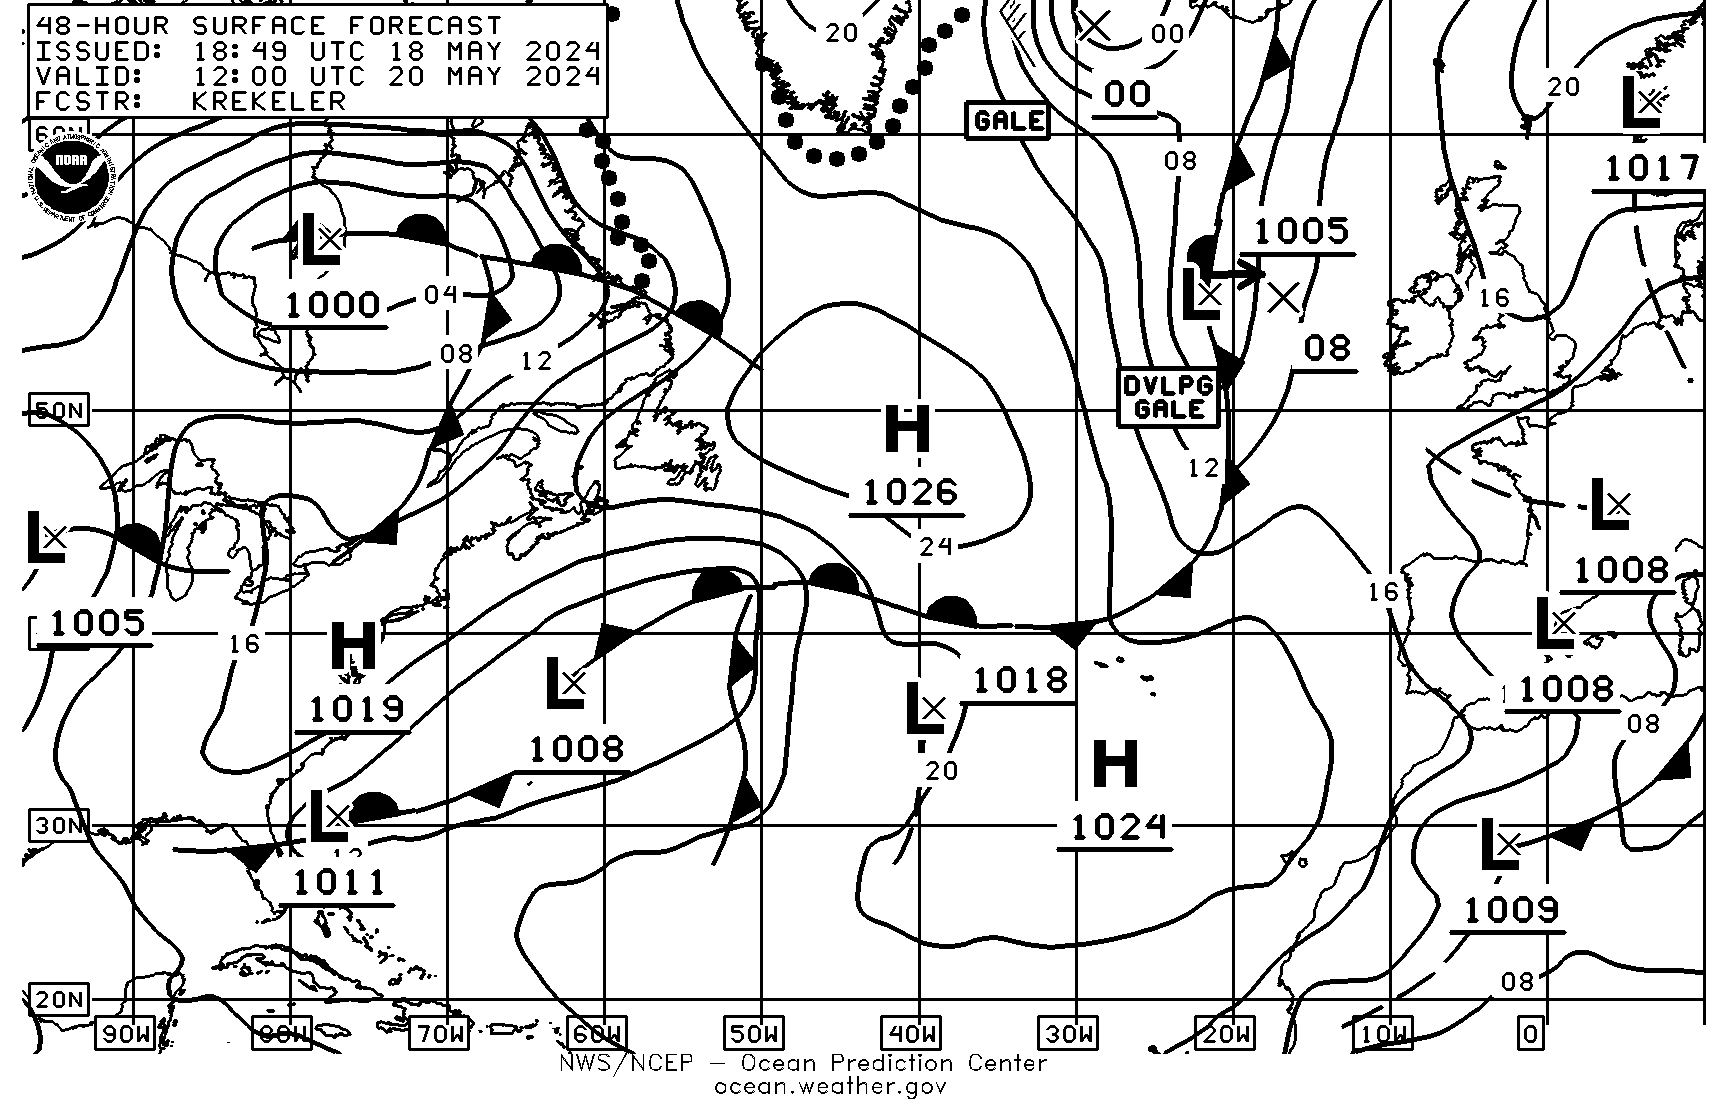
| 1955Z | 48Hr Surface/Ice Accretion VT 12Z (15N-65N, 10E-95W) | QDTM86 | TIF|GIF|B/W GIF | 16:30Z Jul 19 2026 |
| 2005Z | 48Hr Wind&Wave VT 12Z (15N-65N, 10E-95W) | PJAI99 | TIF|GIF|B/W GIF | 16:30Z Jul 19 2026 |
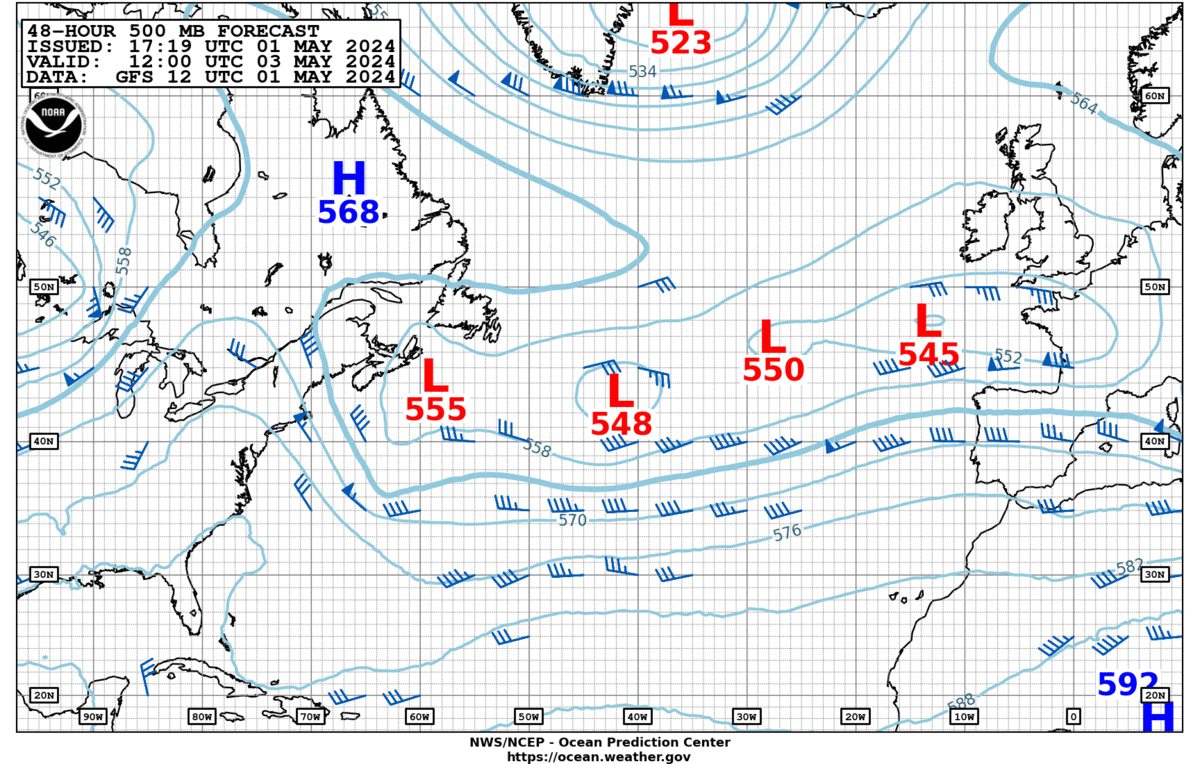
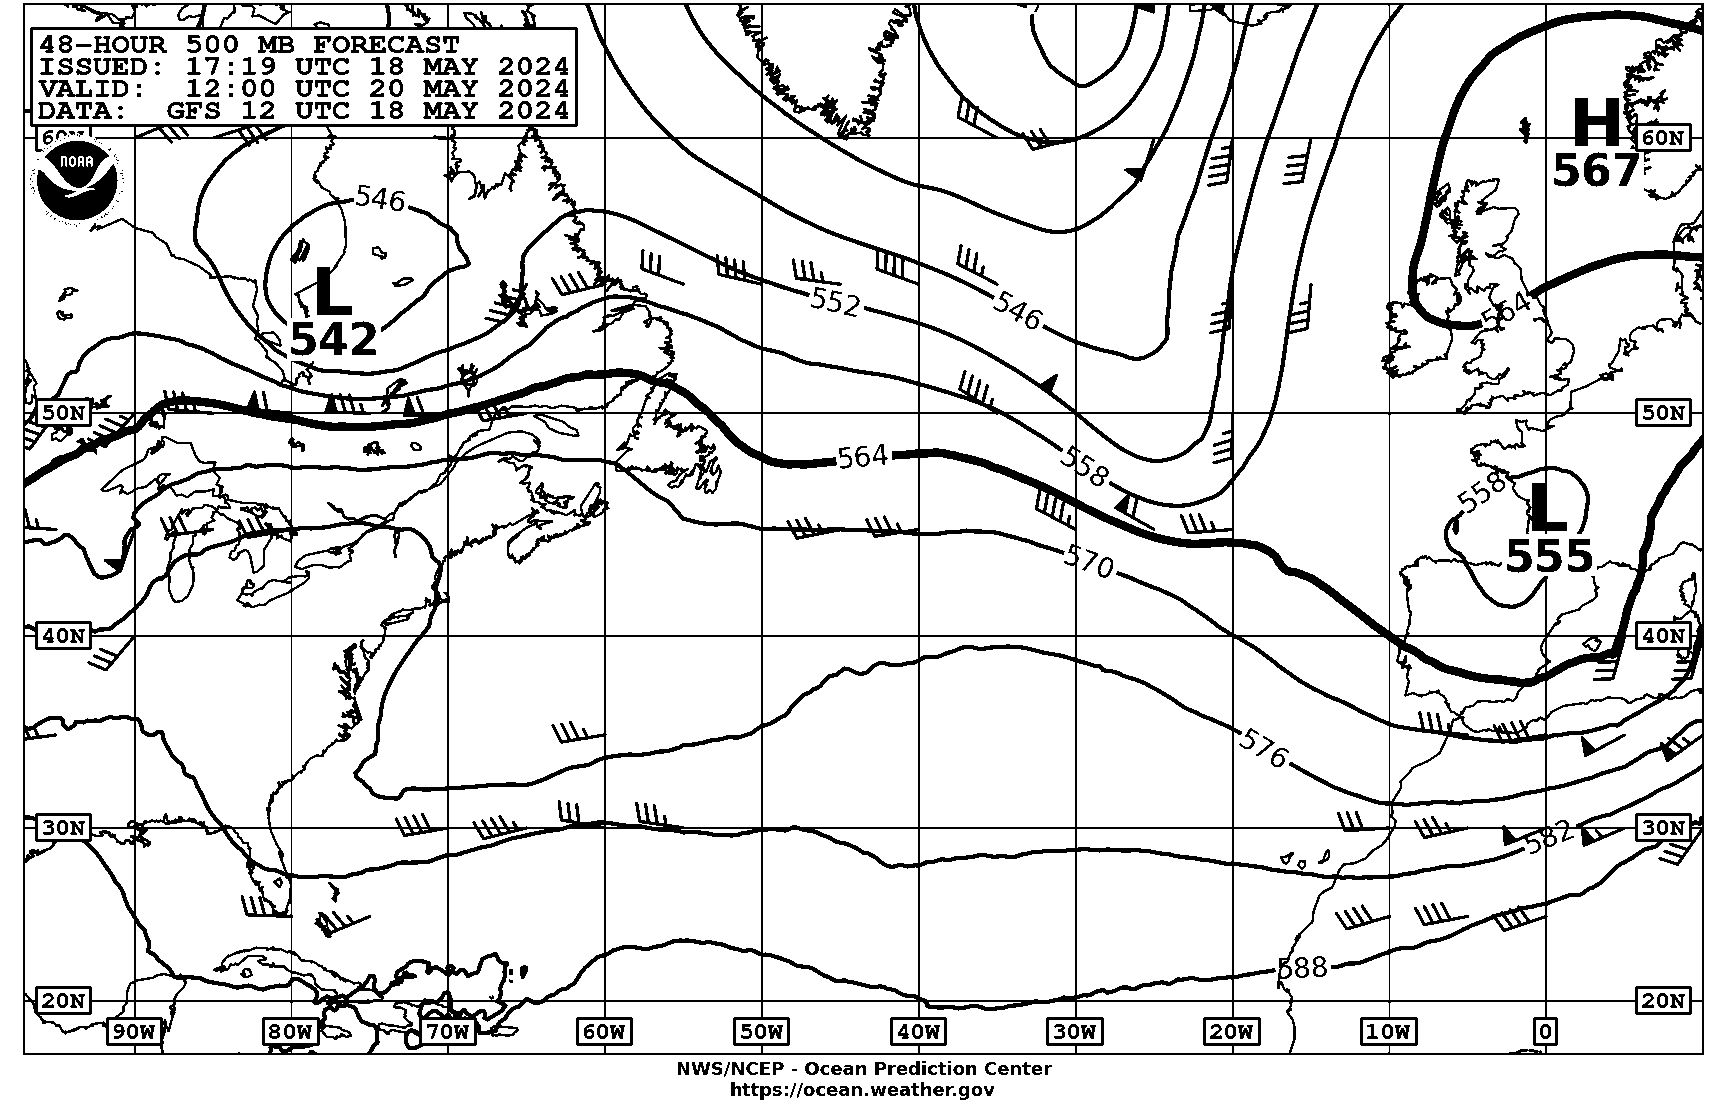
| 2015Z | 48Hr 500mb VT 12Z (15N-65N, 10E-95W) | PPAI51 | TIF|GIF|B/W GIF | 17:21Z Jul 19 2026 |
| 2025Z | 48Hr Peak Wave Period&Direction VT 12Z (15N-65N, 10E-95W) | PJAI89 | TIF|GIF|B/W GIF | 16:56Z Jul 19 2026 |
| 2035Z | 18Z Preliminary Surface Analysis (28N-52N, 45W-85W) | PYAD01 | TIF|GIF | |
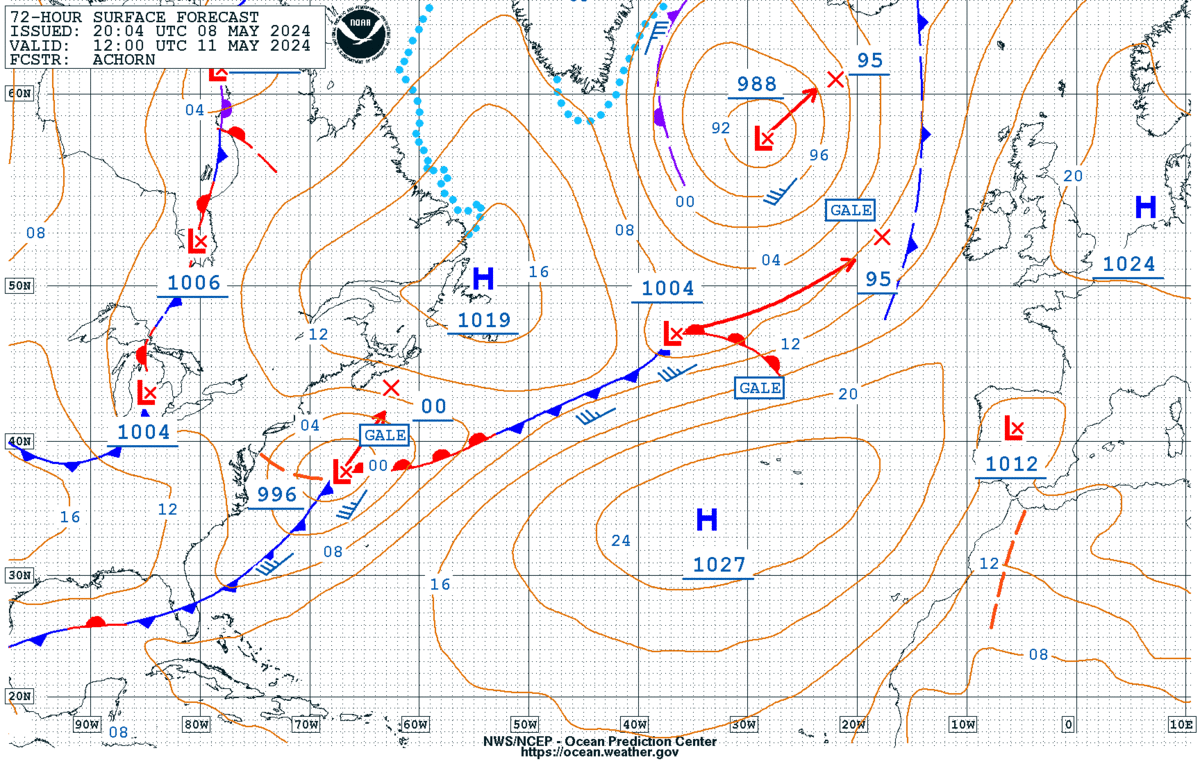
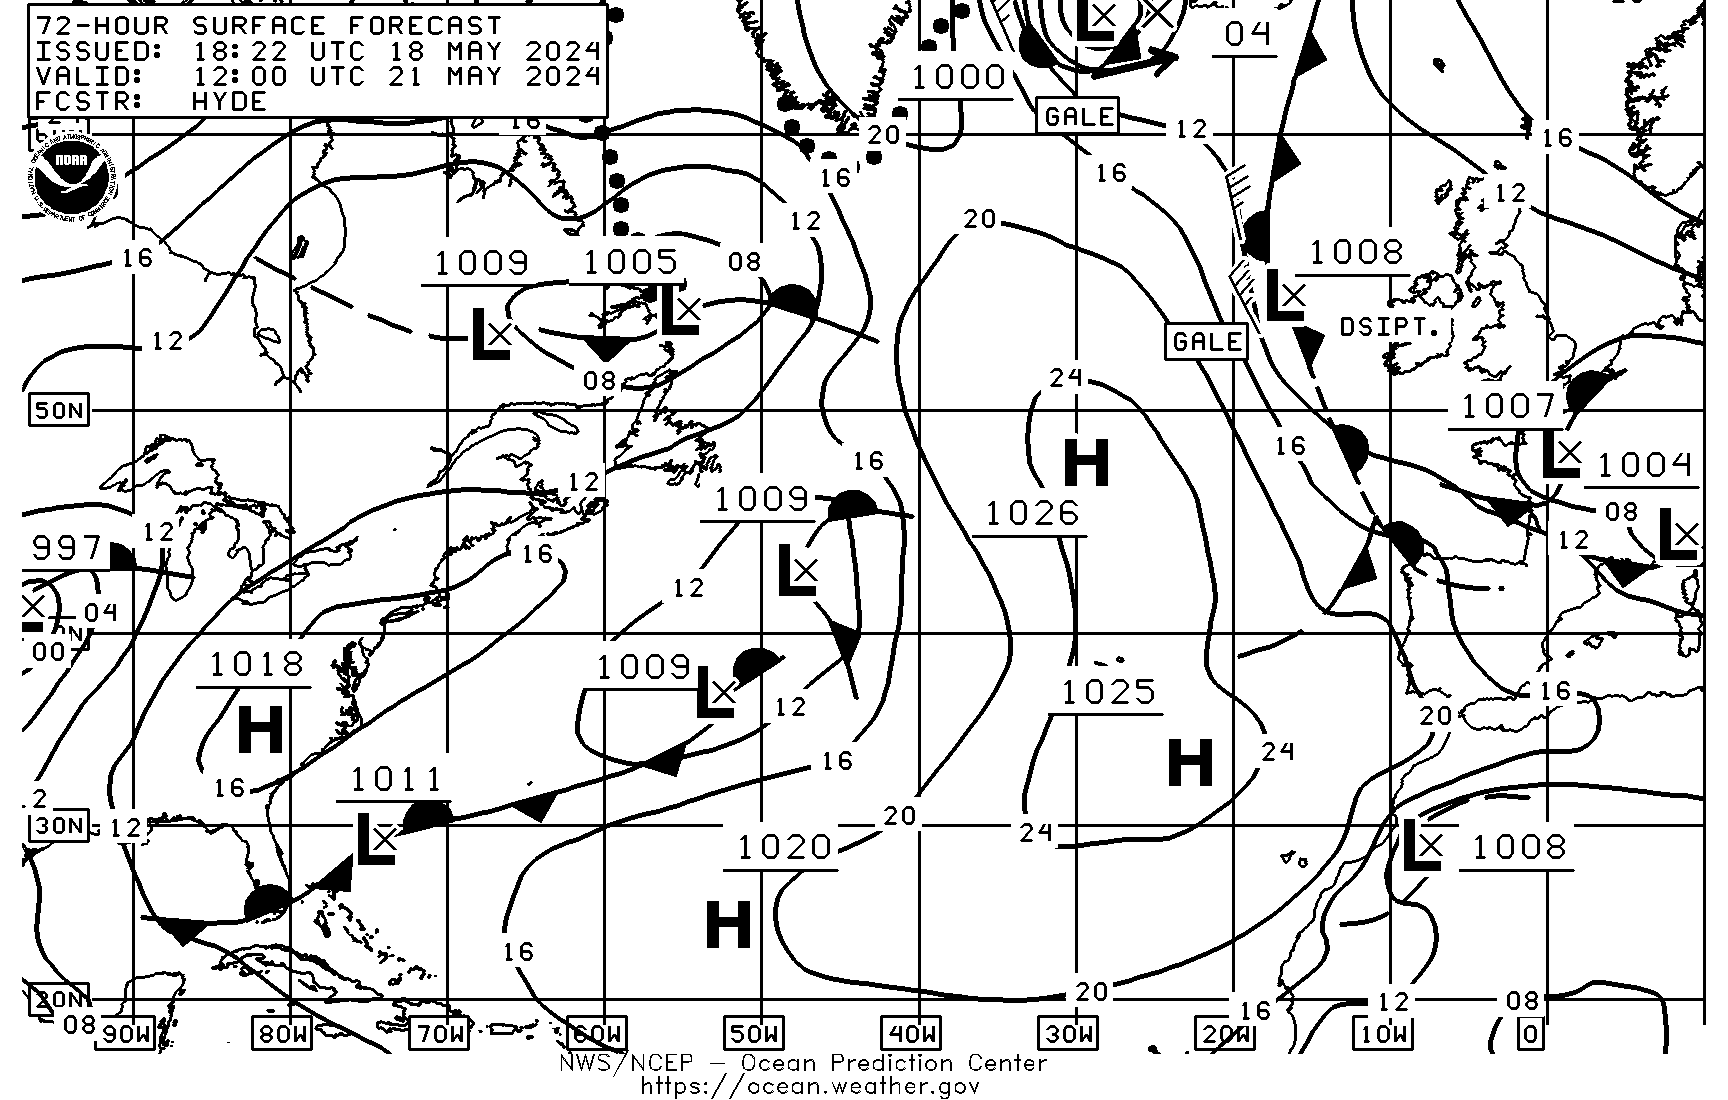
| 2045Z | 72Hr Surface/Ice Accretion VT 12Z (15N-65N, 10E-95W) | PPAK98 | TIF|GIF|B/W GIF | 17:18Z Jun 01 2026 |
| 2055Z | 72Hr Wind&Wave VT 12Z (15N-65N, 10E-95W) | PJAK88 | TIF|GIF|B/W GIF | 17:16Z Jul 19 2026 |
| 2105Z | 72Hr 500mb VT 12Z (15N-65N, 10E-95W) | PHAK50 | TIF|GIF|B/W GIF | 17:21Z Jul 19 2026 |
| 2115Z | 72Hr Peak Wave Period&Direction VT 12Z (15N-65N, 10E-95W) | PKAK88 | TIF|GIF|B/W GIF | 16:57Z Jul 19 2026 |
| 2125Z | 18Z Surface Analysis Part 1 (15N-65N, 10E-45W) | PYAA07 | TIF|GIF|B/W GIF | 21:23Z Jul 19 2026 |
| 2138Z | 18Z Surface Analysis Part 2 (15N-65N, 40W-95W) | PYAA08 | TIF|GIF|B/W GIF | 21:23Z Jul 19 2026 |
| 2151Z | Satellite Picture (00N-60N, 40W-130W) | EVNT18 | JPG | |
| 2202Z | Retransmit 2125Z: 18Z Surface Analysis Part 1 (15N-65N, 10E-45W) | |||
| 2215Z | Retransmit 2138Z: 18Z Surface Analysis Part 2 (15N-65N, 40W-95W) | |||
| 2228Z | Cyclone Danger Area (*see note above) or High Wind&Wave**(5N-40N, 35W-100W) | PWEK88 | TIF|GIF | |
| 2239Z | North American Ice Service Chart | PIEA88 | TIF|GIF |
Abbreviations: VT=VALID TIME, Hr=Hour
Comments On this Schedule Or Quality Of Charts Are Invited.