Hurricane Warnings in Effect
Atlantic:  High Seas

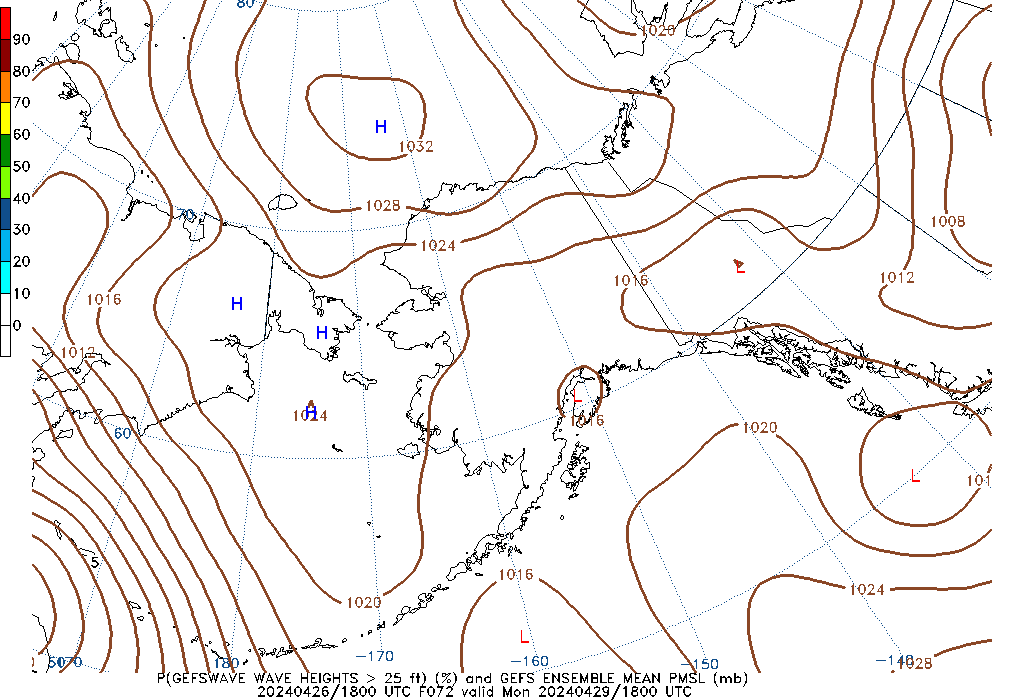
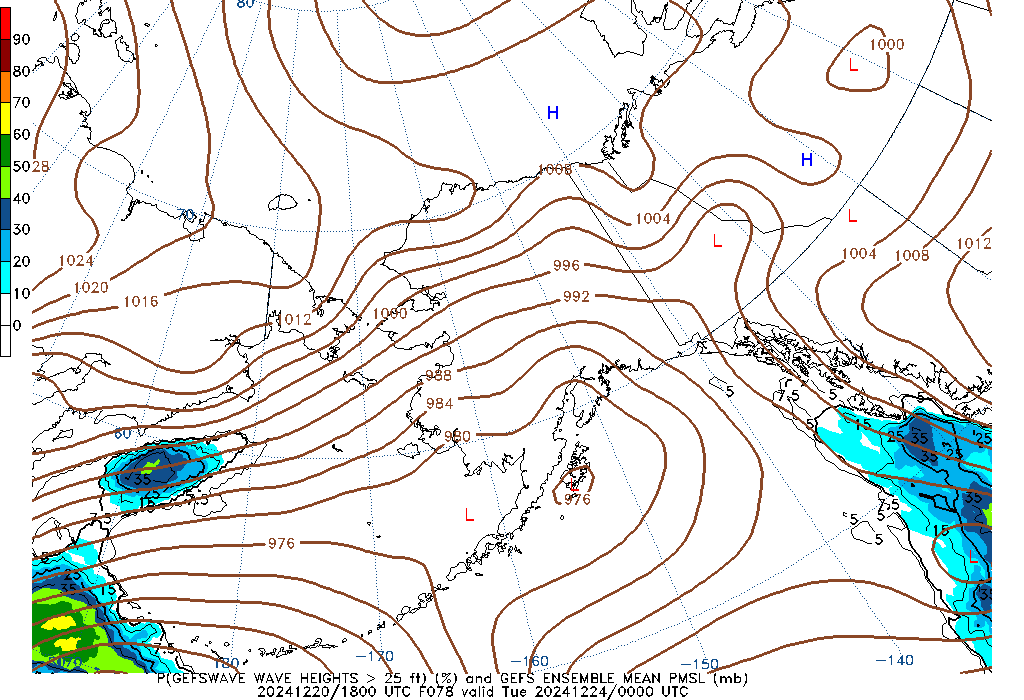
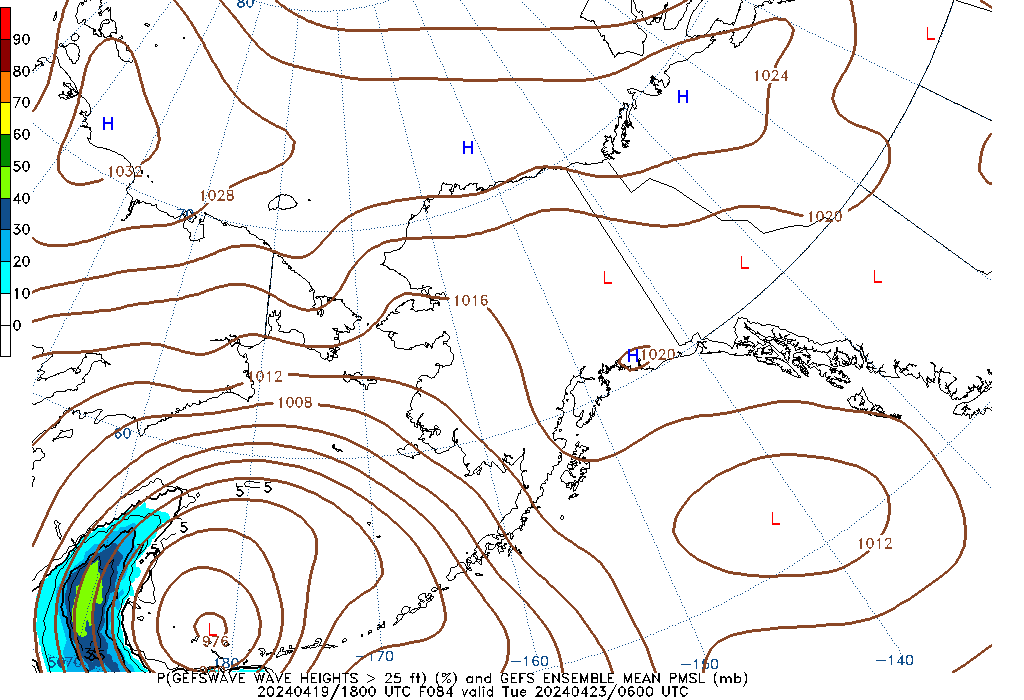
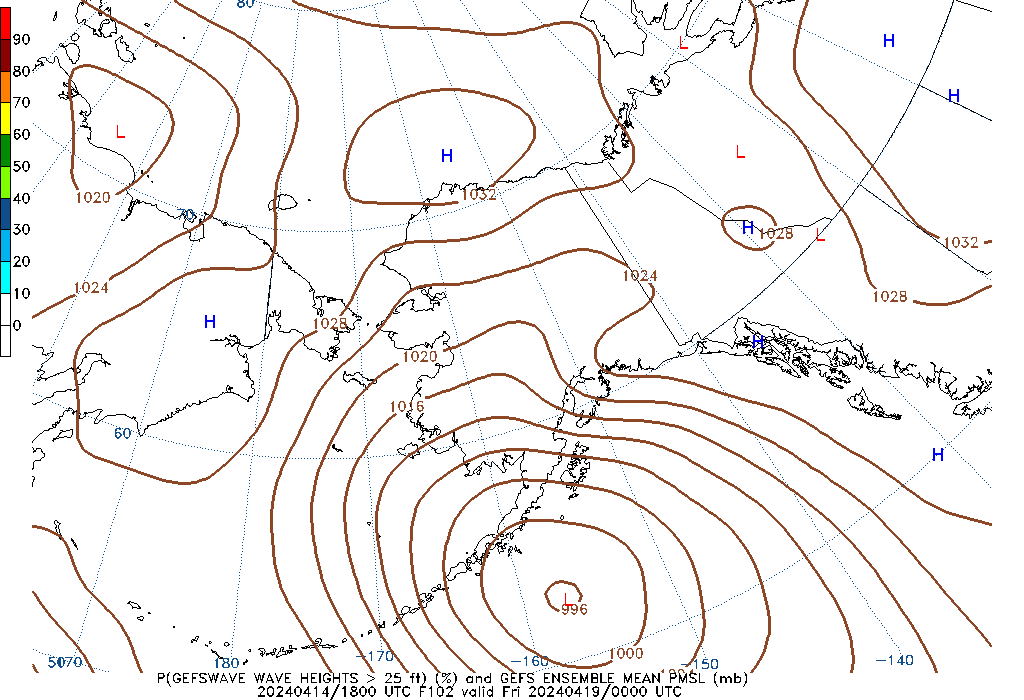
GEFSWAVE Probabilistic Wave Height Guidance

Use the drop down menus below to change the display.


NOTICE: Images are older than 24 hours. Use with caution!
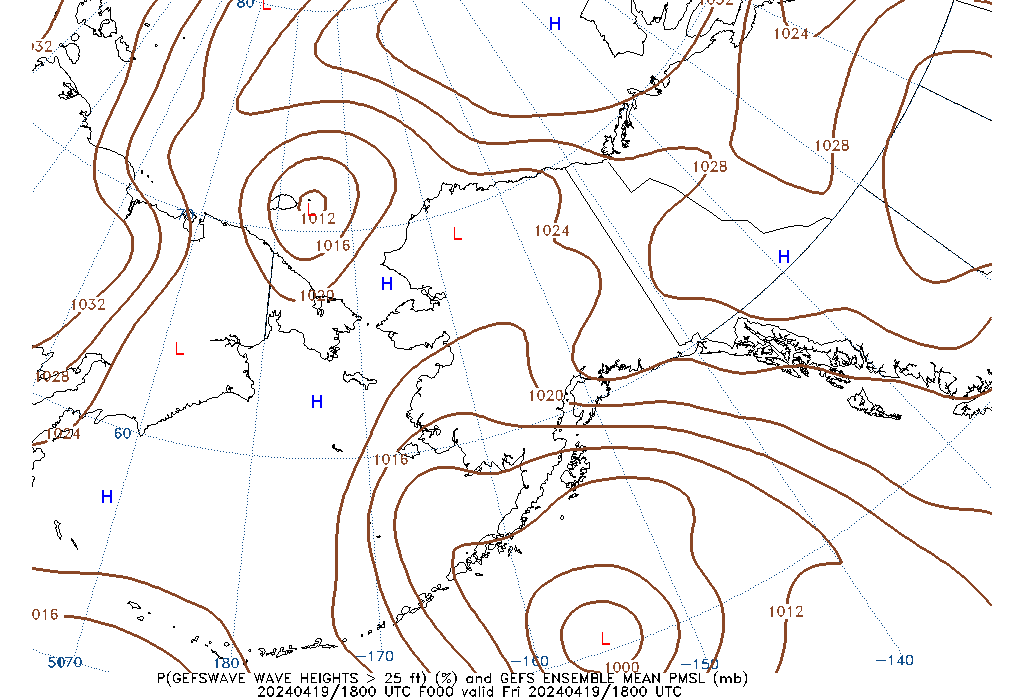
GEFSWAVE 000 Hour Wave Height greater than 25ft image GEFSWAVE 006 Hour Wave Height greater than 25ft image
000 Hour Wave Height greater than 25ft

006 Hour Wave Height greater than 25ft

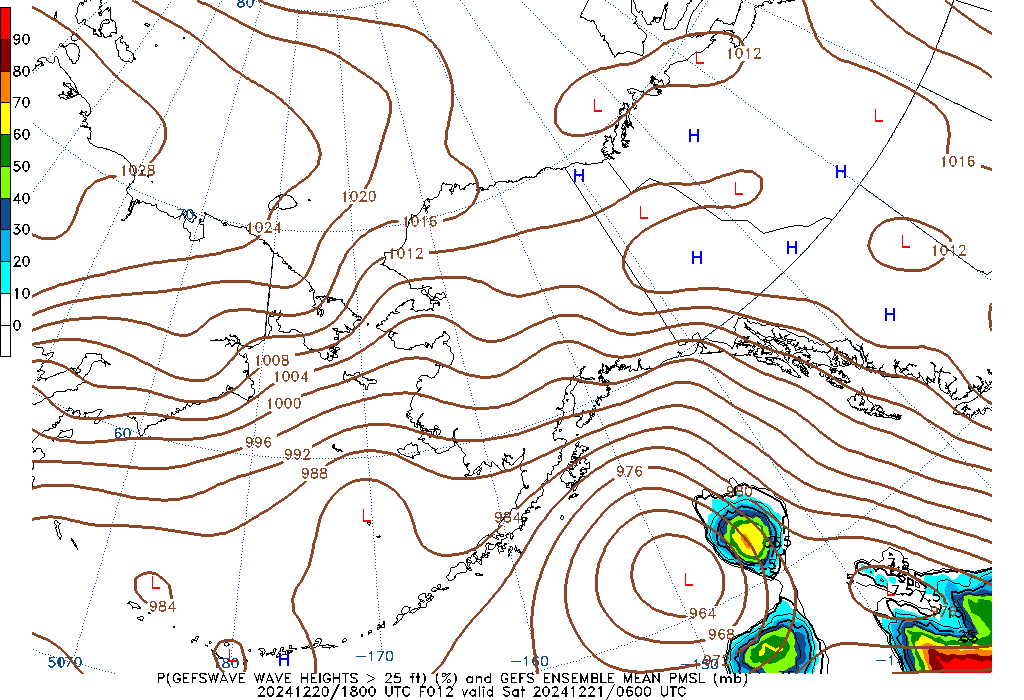
GEFSWAVE 012 Hour Wave Height greater than 25ft image GEFSWAVE 018 Hour Wave Height greater than 25ft image
012 Hour Wave Height greater than 25ft

018 Hour Wave Height greater than 25ft

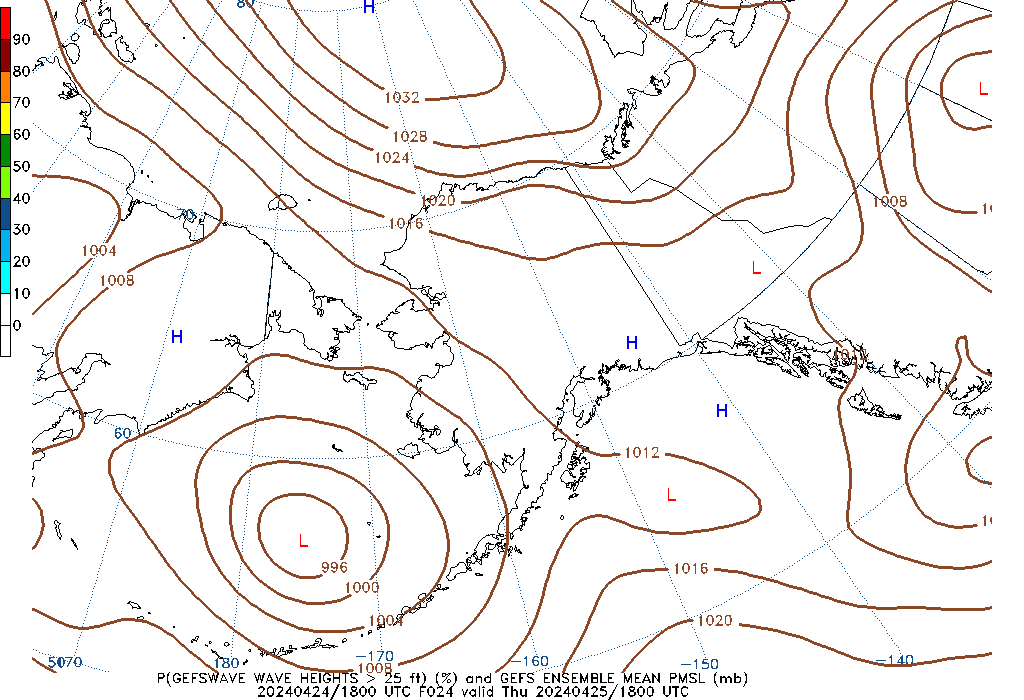
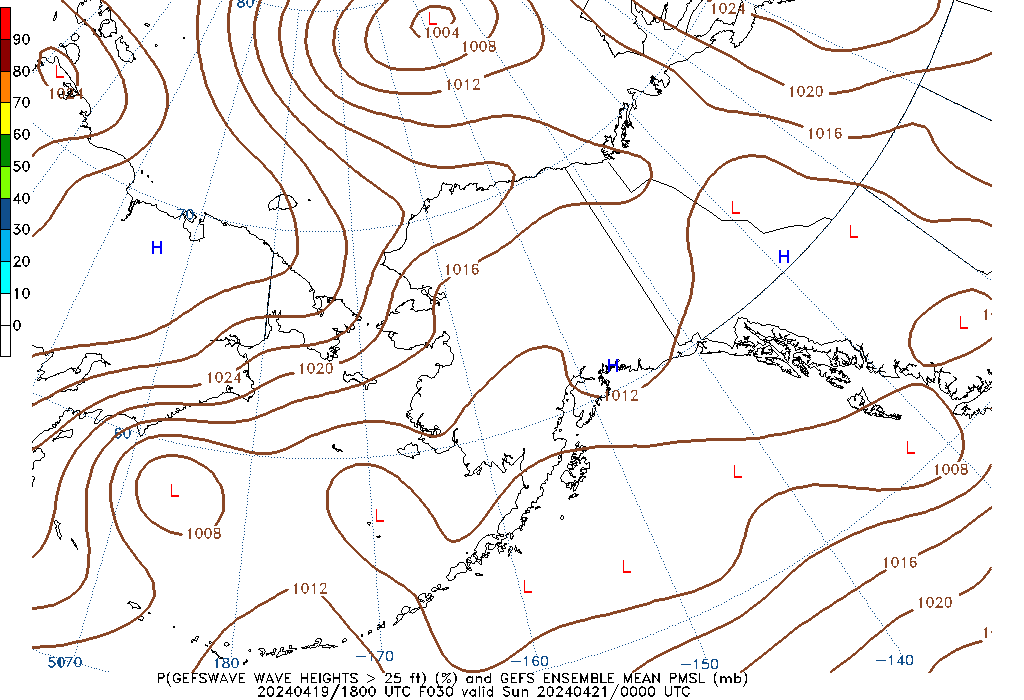
GEFSWAVE 024 Hour Wave Height greater than 25ft image GEFSWAVE 030 Hour Wave Height greater than 25ft image
024 Hour Wave Height greater than 25ft

030 Hour Wave Height greater than 25ft

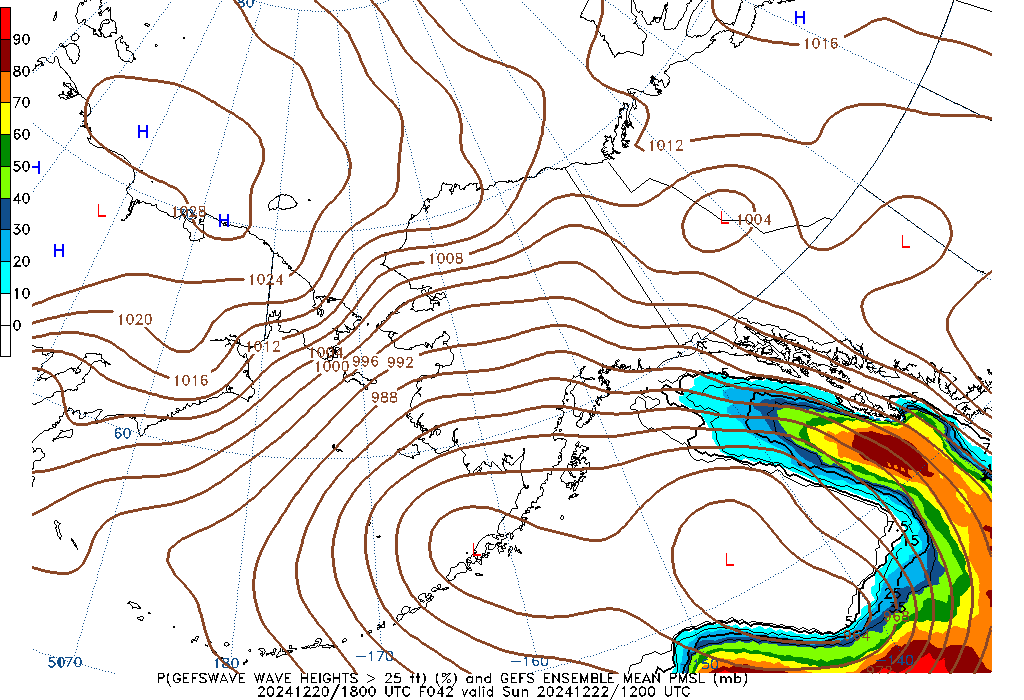
GEFSWAVE 036 Hour Wave Height greater than 25ft image GEFSWAVE 042 Hour Wave Height greater than 25ft image
036 Hour Wave Height greater than 25ft

042 Hour Wave Height greater than 25ft

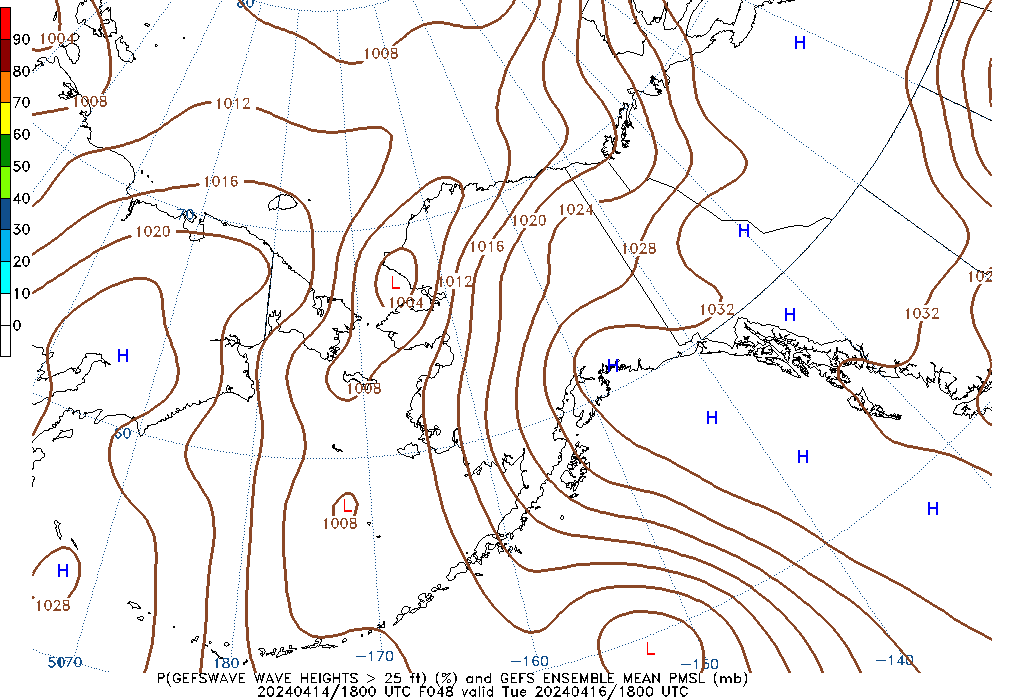
GEFSWAVE 048 Hour Wave Height greater than 25ft image GEFSWAVE 054 Hour Wave Height greater than 25ft image
048 Hour Wave Height greater than 25ft

054 Hour Wave Height greater than 25ft

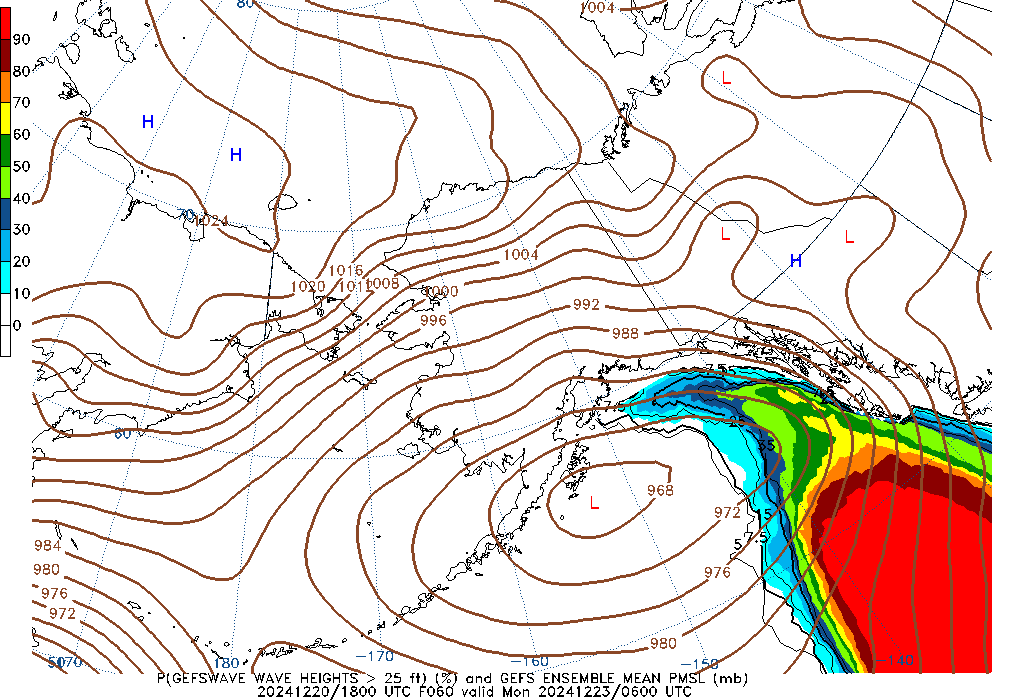
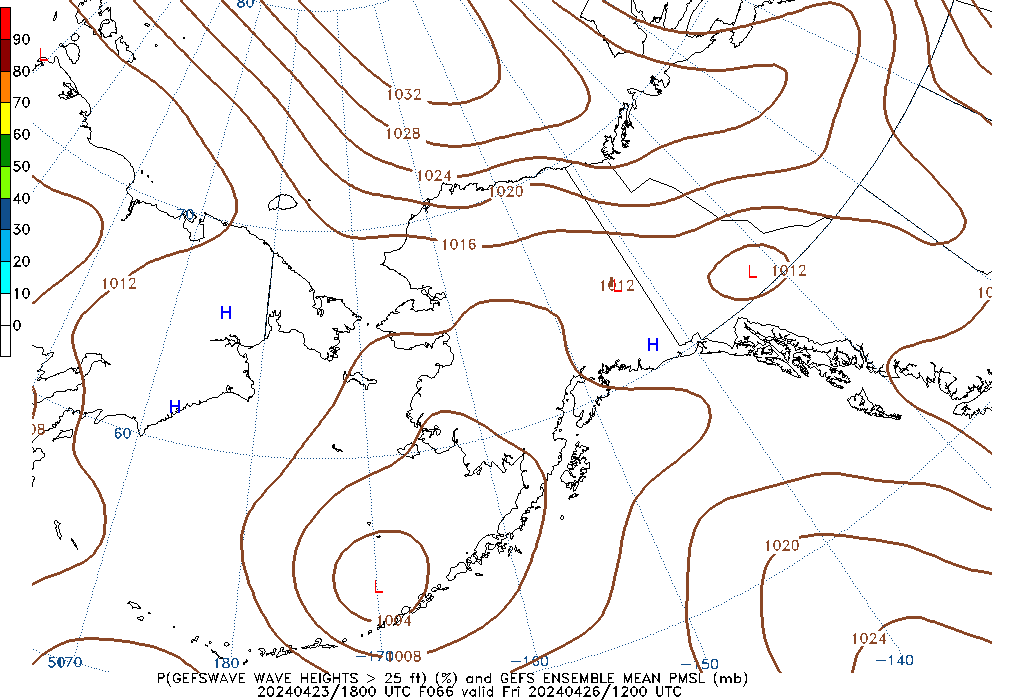
GEFSWAVE 060 Hour Wave Height greater than 25ft image GEFSWAVE 066 Hour Wave Height greater than 25ft image
060 Hour Wave Height greater than 25ft

066 Hour Wave Height greater than 25ft

GEFSWAVE 072 Hour Wave Height greater than 25ft image GEFSWAVE 078 Hour Wave Height greater than 25ft image
072 Hour Wave Height greater than 25ft

078 Hour Wave Height greater than 25ft

GEFSWAVE 084 Hour Wave Height greater than 25ft image GEFSWAVE 090 Hour Wave Height greater than 25ft image
084 Hour Wave Height greater than 25ft

090 Hour Wave Height greater than 25ft

GEFSWAVE 096 Hour Wave Height greater than 25ft image GEFSWAVE 102 Hour Wave Height greater than 25ft image
096 Hour Wave Height greater than 25ft

102 Hour Wave Height greater than 25ft

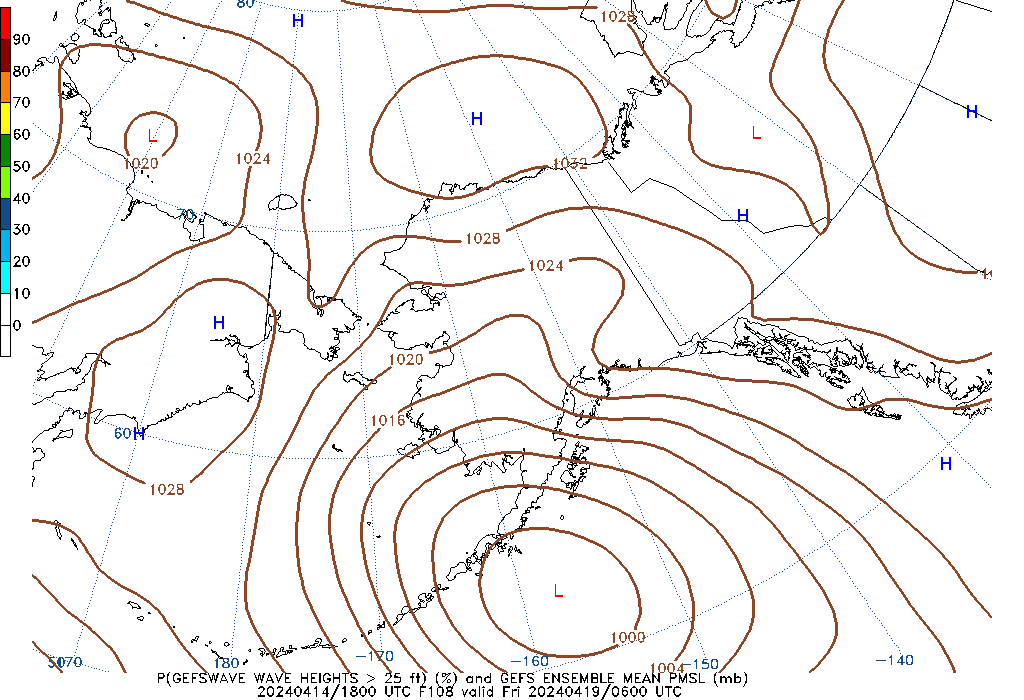
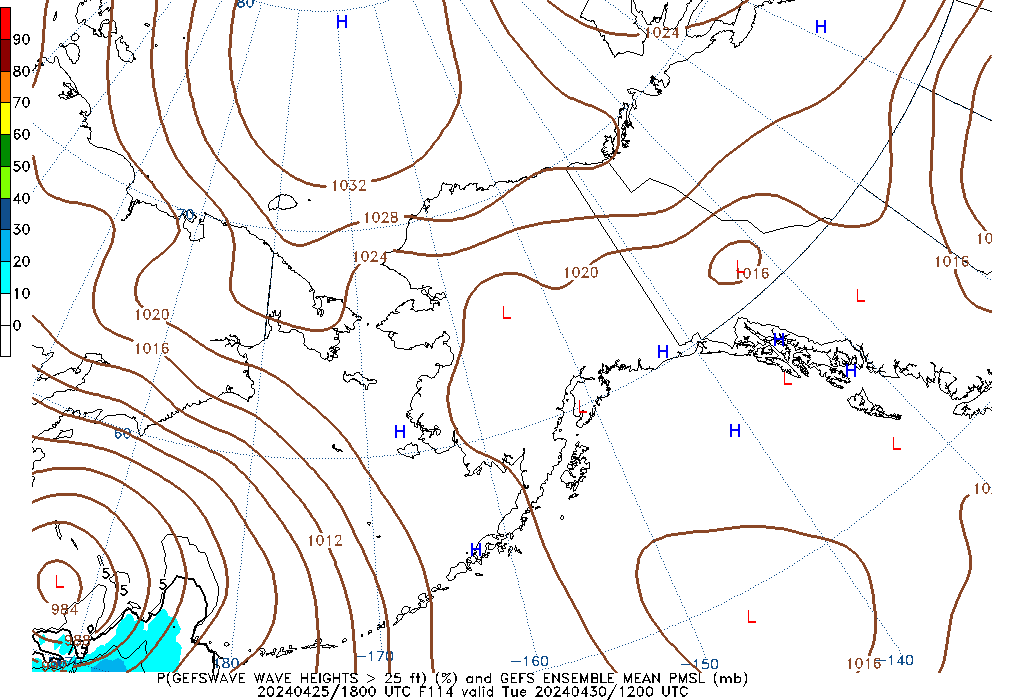
GEFSWAVE 108 Hour Wave Height greater than 25ft image GEFSWAVE 114 Hour Wave Height greater than 25ft image
108 Hour Wave Height greater than 25ft

114 Hour Wave Height greater than 25ft

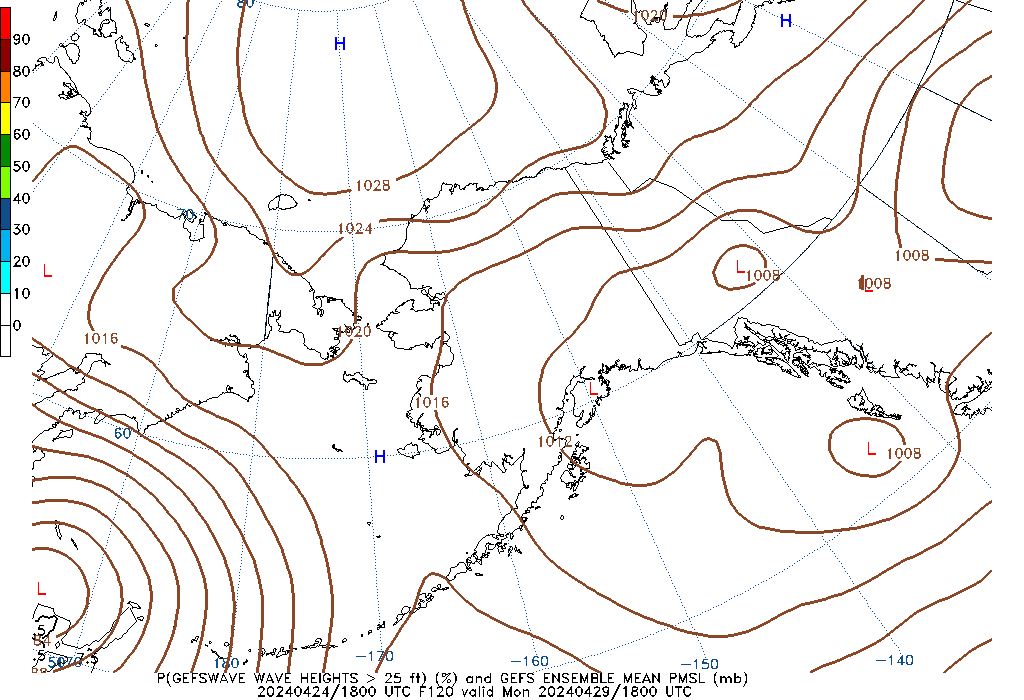
GEFSWAVE 120 Hour Wave Height greater than 25ft image GEFSWAVE 126 Hour Wave Height greater than 25ft image
120 Hour Wave Height greater than 25ft

126 Hour Wave Height greater than 25ft

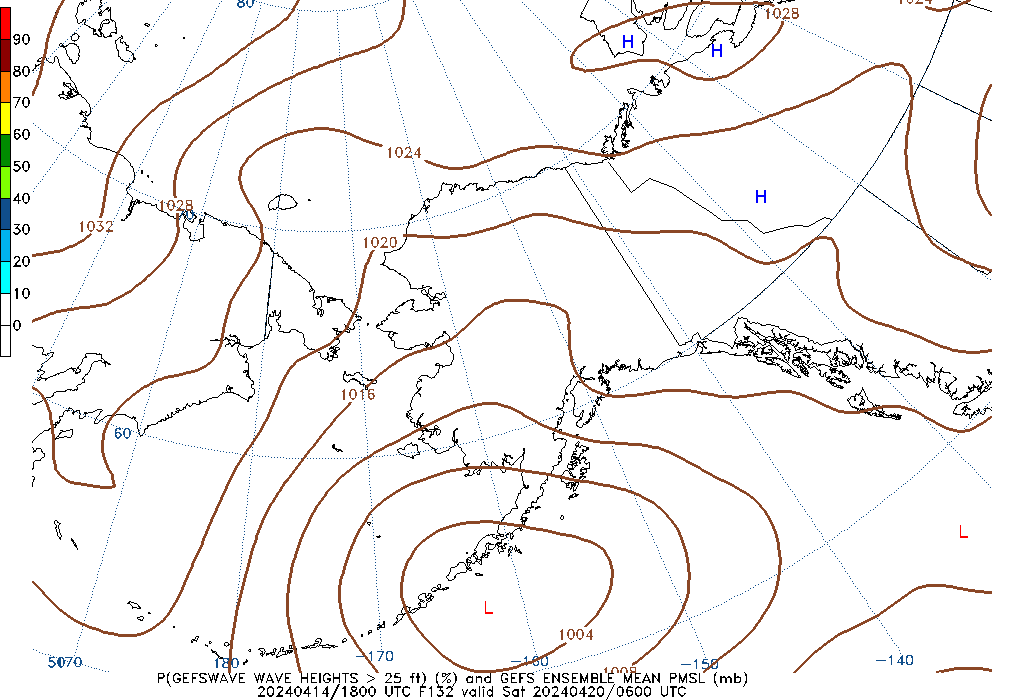
GEFSWAVE 132 Hour Wave Height greater than 25ft image GEFSWAVE 138 Hour Wave Height greater than 25ft image
132 Hour Wave Height greater than 25ft

138 Hour Wave Height greater than 25ft

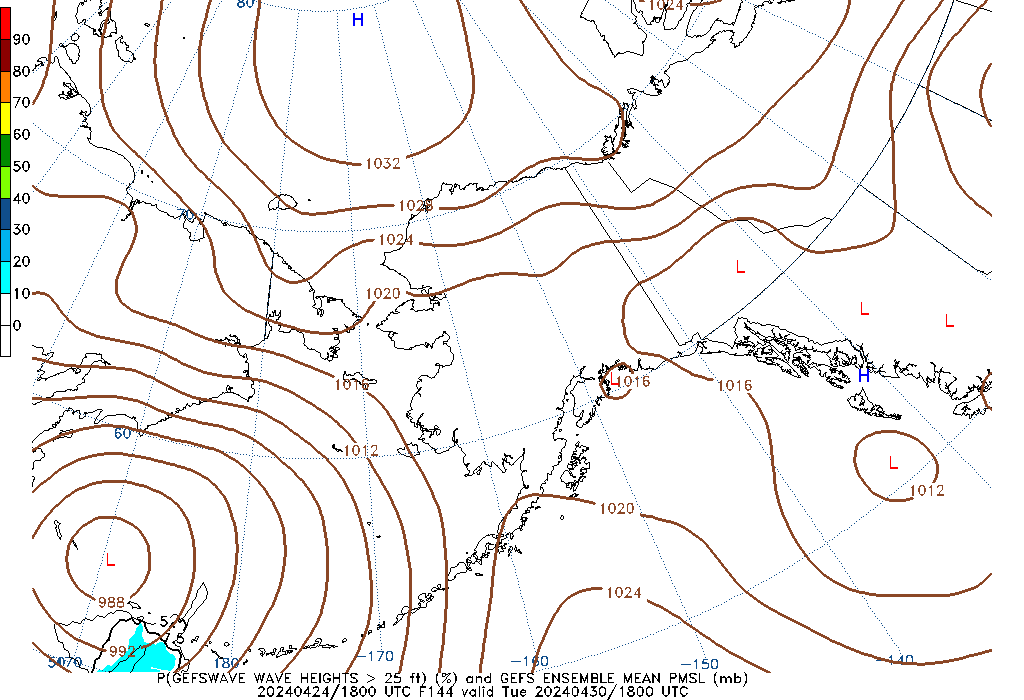
GEFSWAVE 144 Hour Wave Height greater than 25ft image GEFSWAVE 150 Hour Wave Height greater than 25ft image
144 Hour Wave Height greater than 25ft

150 Hour Wave Height greater than 25ft

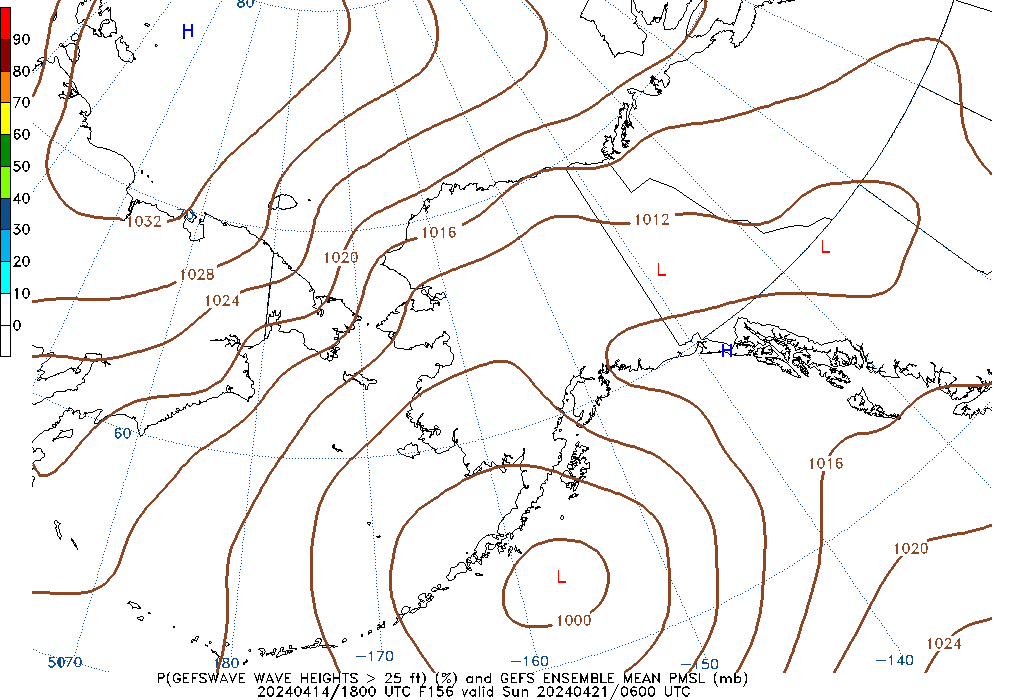
GEFSWAVE 156 Hour Wave Height greater than 25ft image GEFSWAVE 162 Hour Wave Height greater than 25ft image
156 Hour Wave Height greater than 25ft

162 Hour Wave Height greater than 25ft

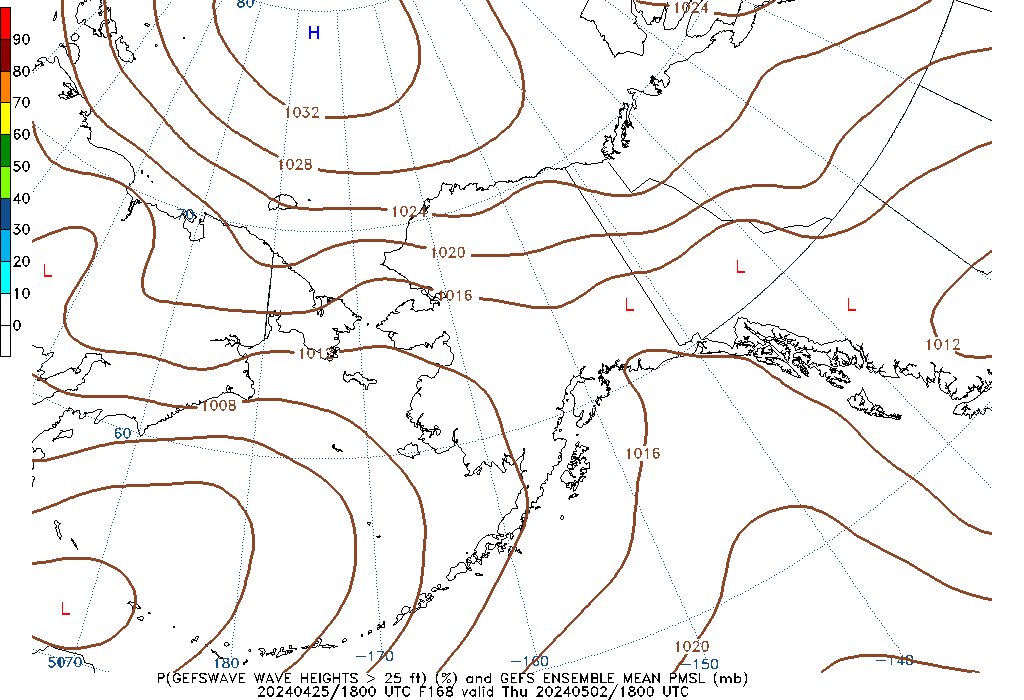
GEFSWAVE 168 Hour Wave Height greater than 25ft image GEFSWAVE 174 Hour Wave Height greater than 25ft image
168 Hour Wave Height greater than 25ft

174 Hour Wave Height greater than 25ft

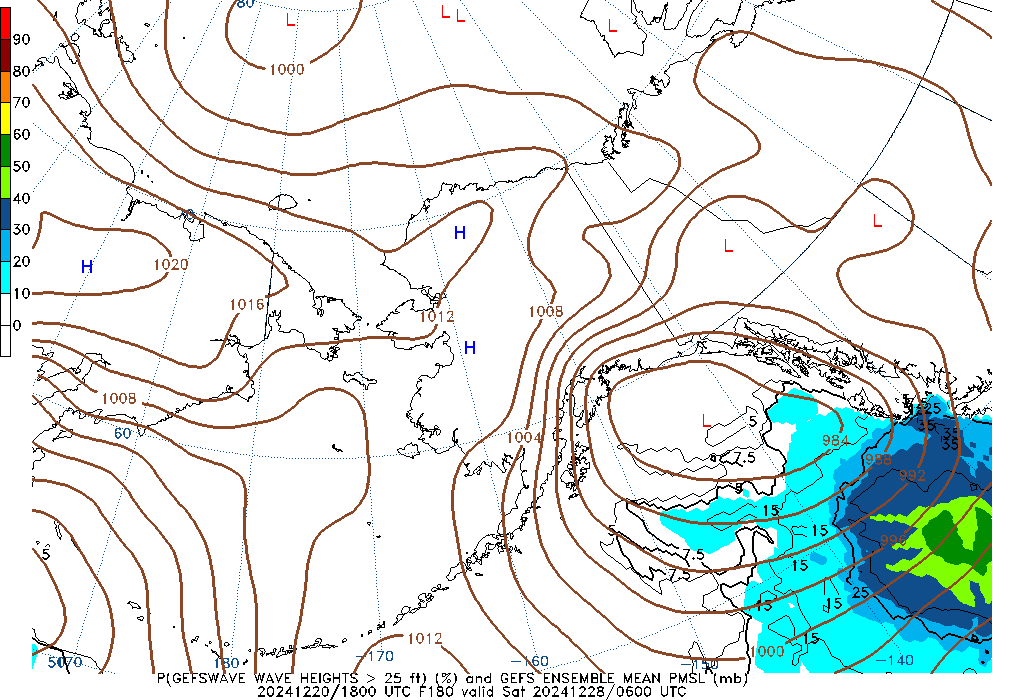
GEFSWAVE 180 Hour Wave Height greater than 25ft image GEFSWAVE 186 Hour Wave Height greater than 25ft image
180 Hour Wave Height greater than 25ft

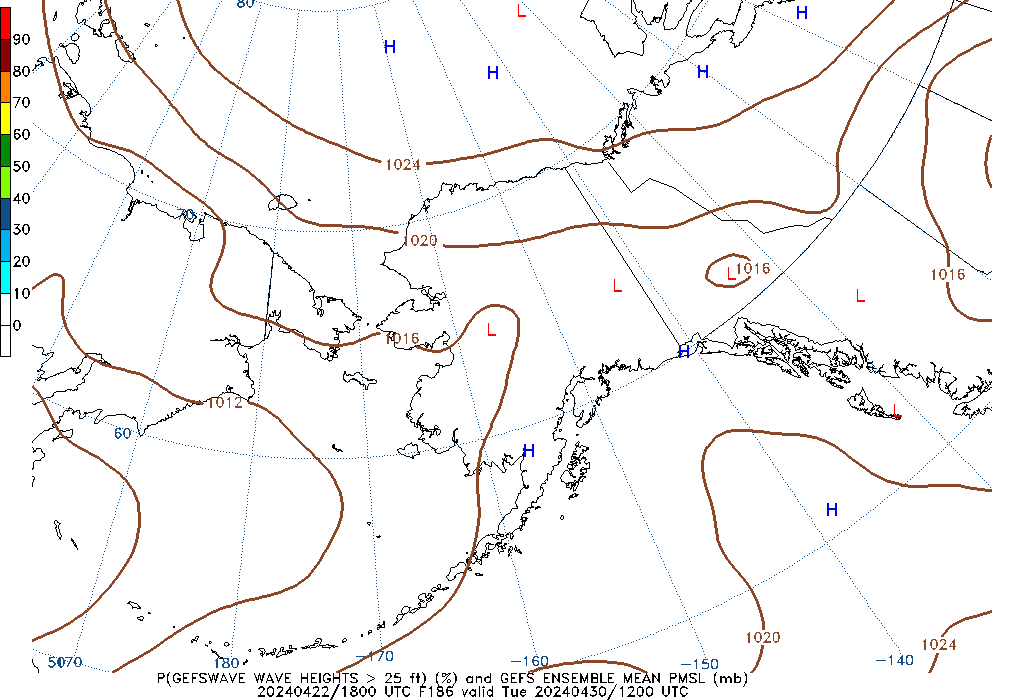
186 Hour Wave Height greater than 25ft

GEFSWAVE 192 Hour Wave Height greater than 25ft image GEFSWAVE 198 Hour Wave Height greater than 25ft image
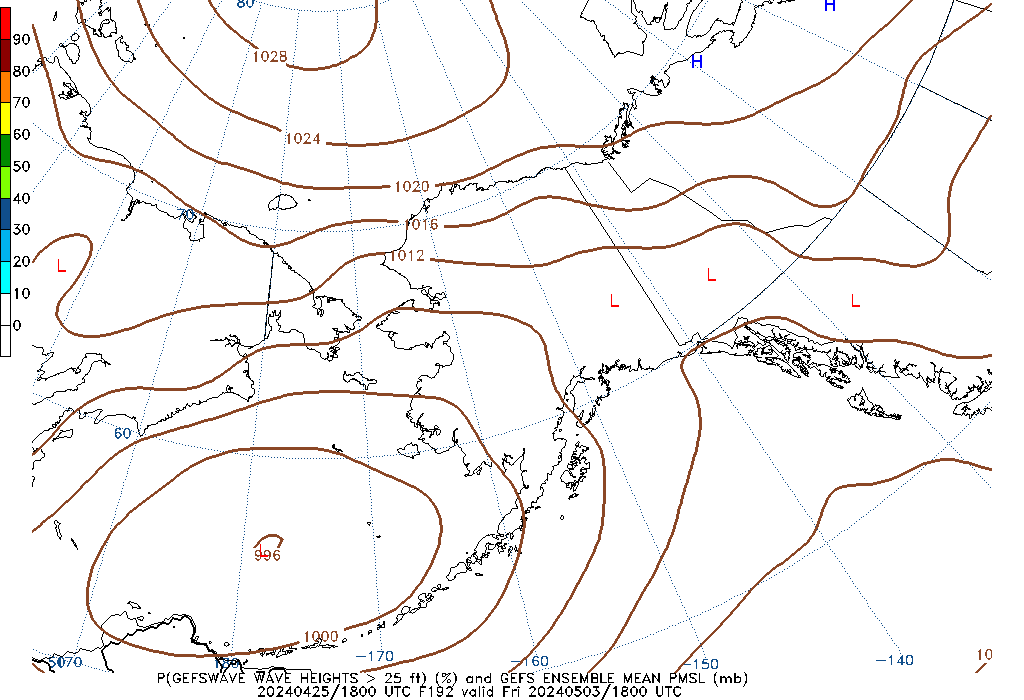
192 Hour Wave Height greater than 25ft

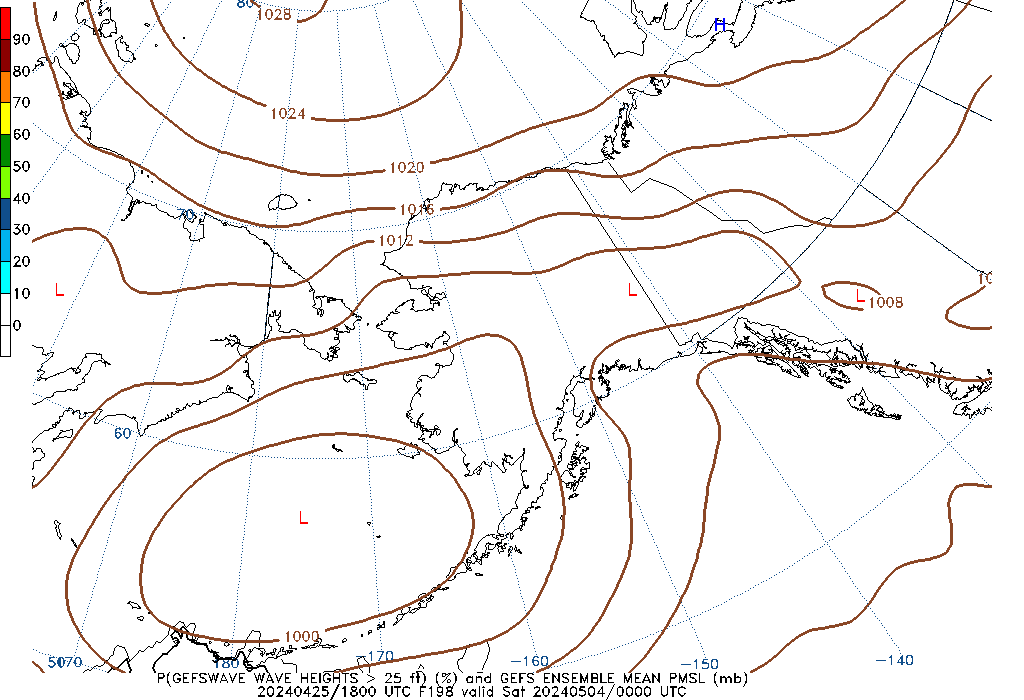
198 Hour Wave Height greater than 25ft

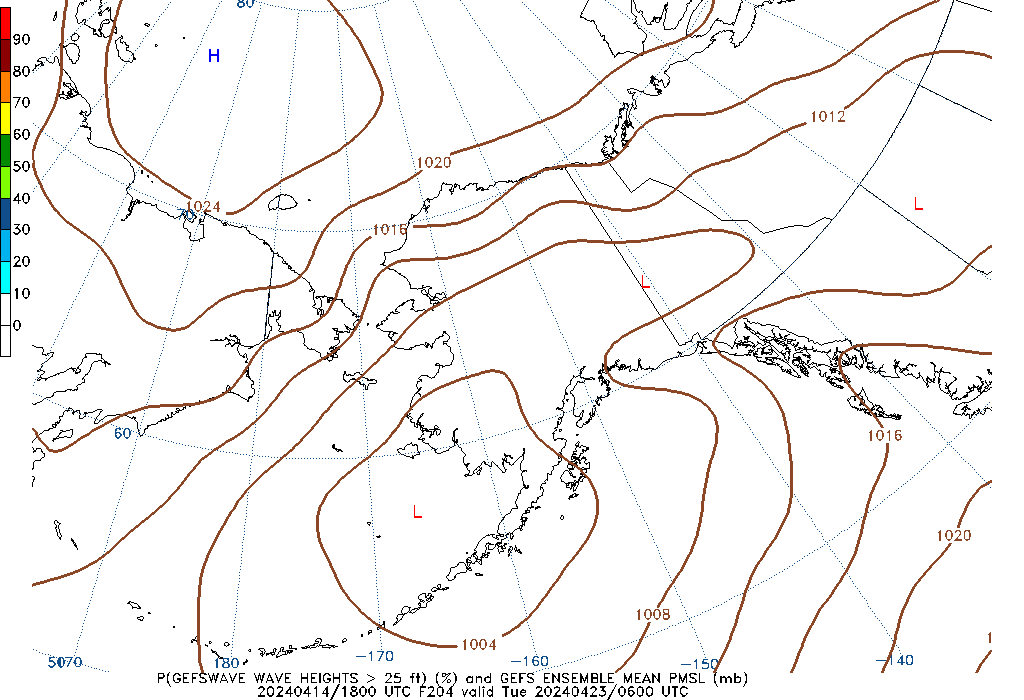
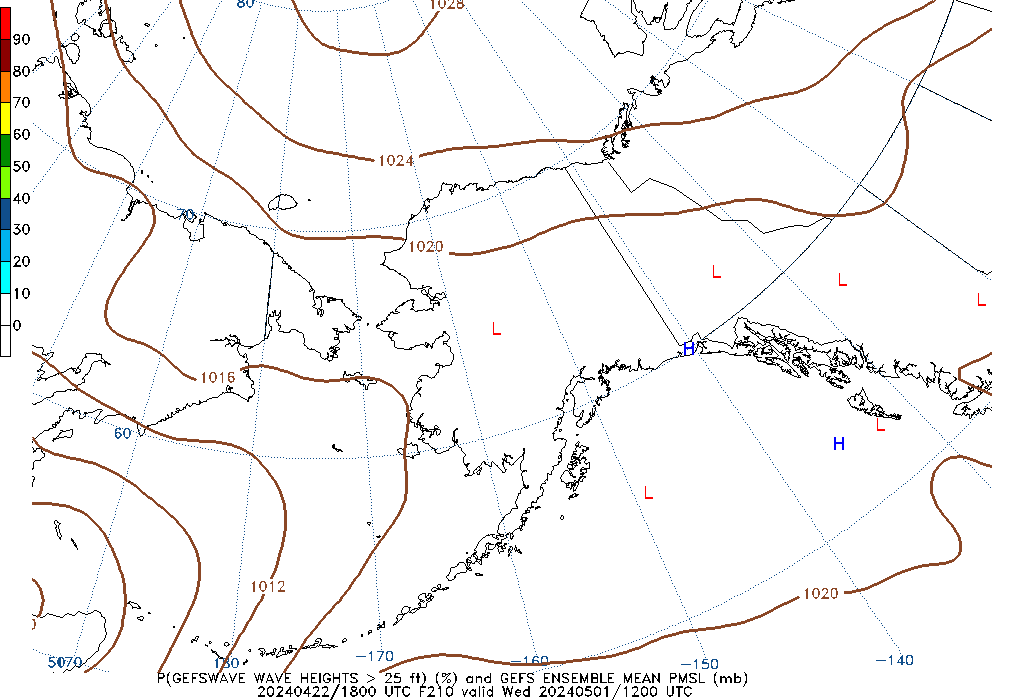
GEFSWAVE 204 Hour Wave Height greater than 25ft image GEFSWAVE 210 Hour Wave Height greater than 25ft image
204 Hour Wave Height greater than 25ft

210 Hour Wave Height greater than 25ft

GEFSWAVE 216 Hour Wave Height greater than 25ft image GEFSWAVE 222 Hour Wave Height greater than 25ft image
216 Hour Wave Height greater than 25ft

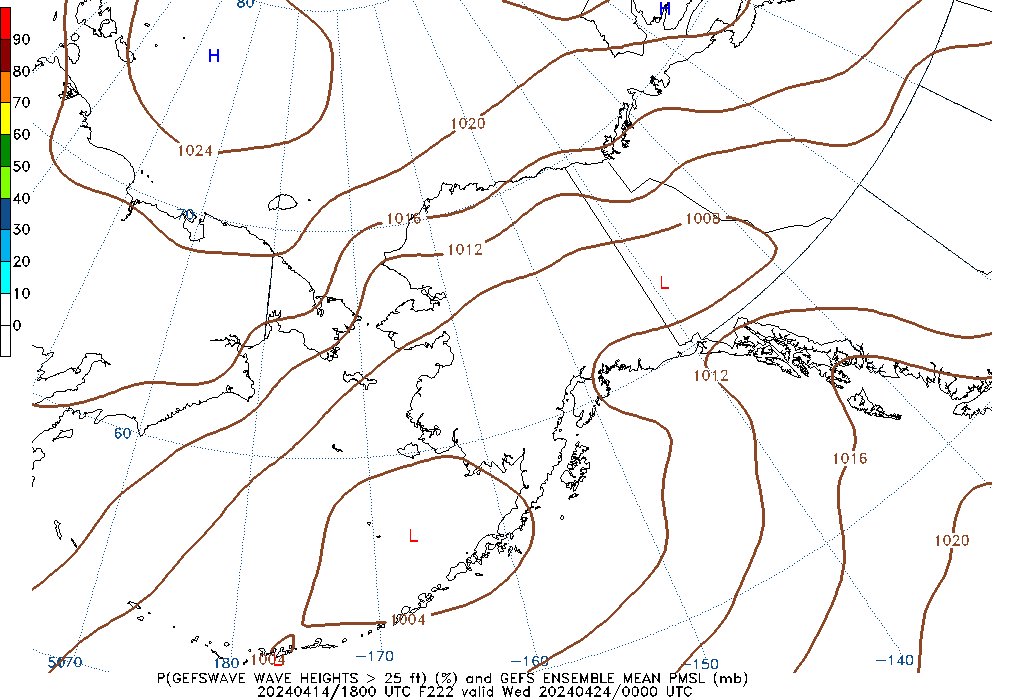
222 Hour Wave Height greater than 25ft

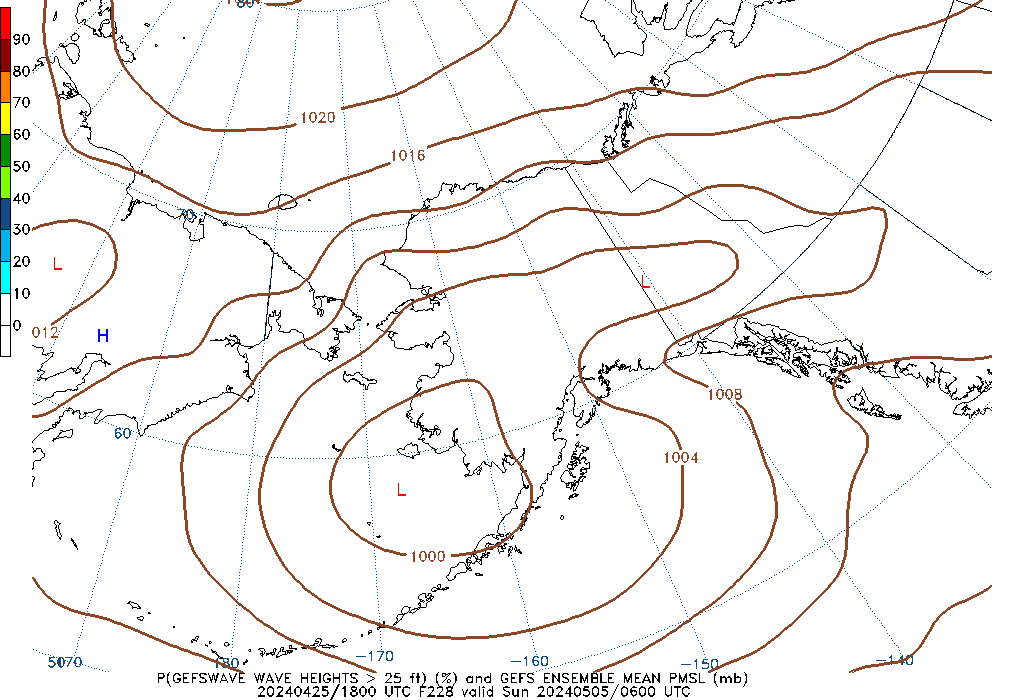
GEFSWAVE 228 Hour Wave Height greater than 25ft image GEFSWAVE 234 Hour Wave Height greater than 25ft image
228 Hour Wave Height greater than 25ft

234 Hour Wave Height greater than 25ft

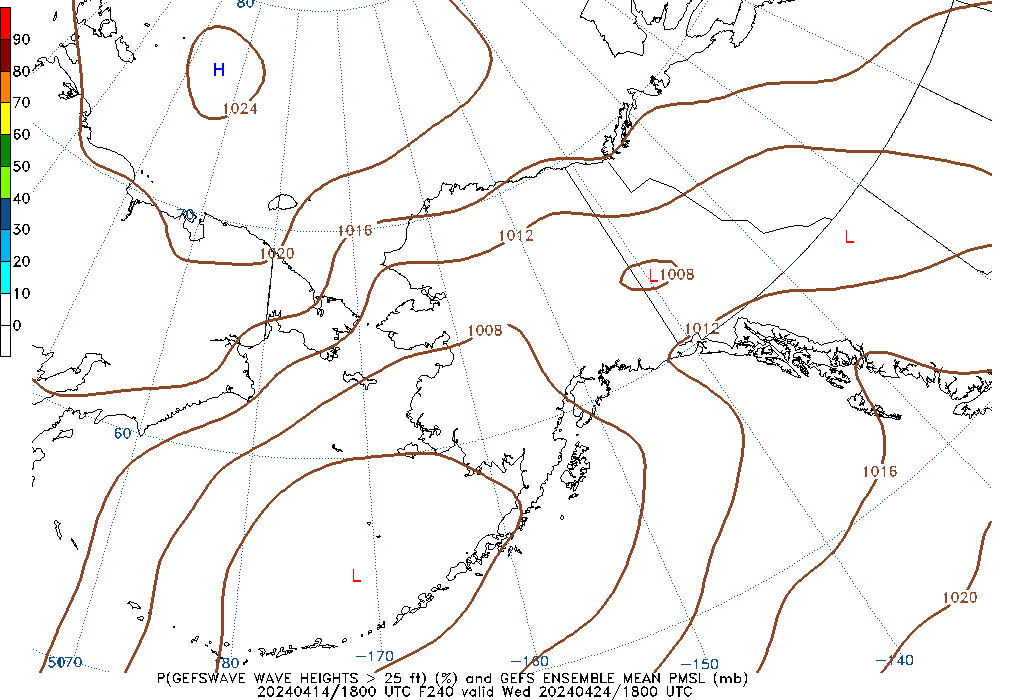
GEFSWAVE 240 Hour Wave Height greater than 25ft image
240 Hour Wave Height greater than 25ft


Notes on images above:

  • The likelihood of exceedance is shown as a probability of 0 to 100 of waves heights (significant wave height) reaching or being greater than the chosen value.

  • The 90th percentile represents the wave height value that 90% of the ensemble members are either less than or equal to (i.e., 18 feet).
  • The 10th percentile is the wave height value that is represented by 10% of the contributing ensemble members.
  • The mean is defined as the 50th percentile, that is, the wave height value represented reflects half the distribution is above and half is below this value.

  • The maximum value is the highest value produced by any of the 31 ensemble members. It reflects the most severe conditions predicted by the ensemble prediction system.

The data are produced from the Global Ensemble Forecast System (GEFS) which is run every 6 hours and are created with 31 ensemble members.

Additional information for interpreting this data

More information is available from NOAA's Environmental Modeling Center (EMC).